
Solar Hot Water System Controller using an ESP32
Recently, I helped my dad install a new solar hot water system onto our roof, replacing the old flat plate collectors with more modern evacuated tubes. The Canberra winters were harsh on the old collectors and they had a tendency to freeze overnight, damaging the internal piping and causing leaks. The new collectors are much more efficient, and take up much less space on the roof. The system worked great for several months, but in the summer we found they worked a little too well.
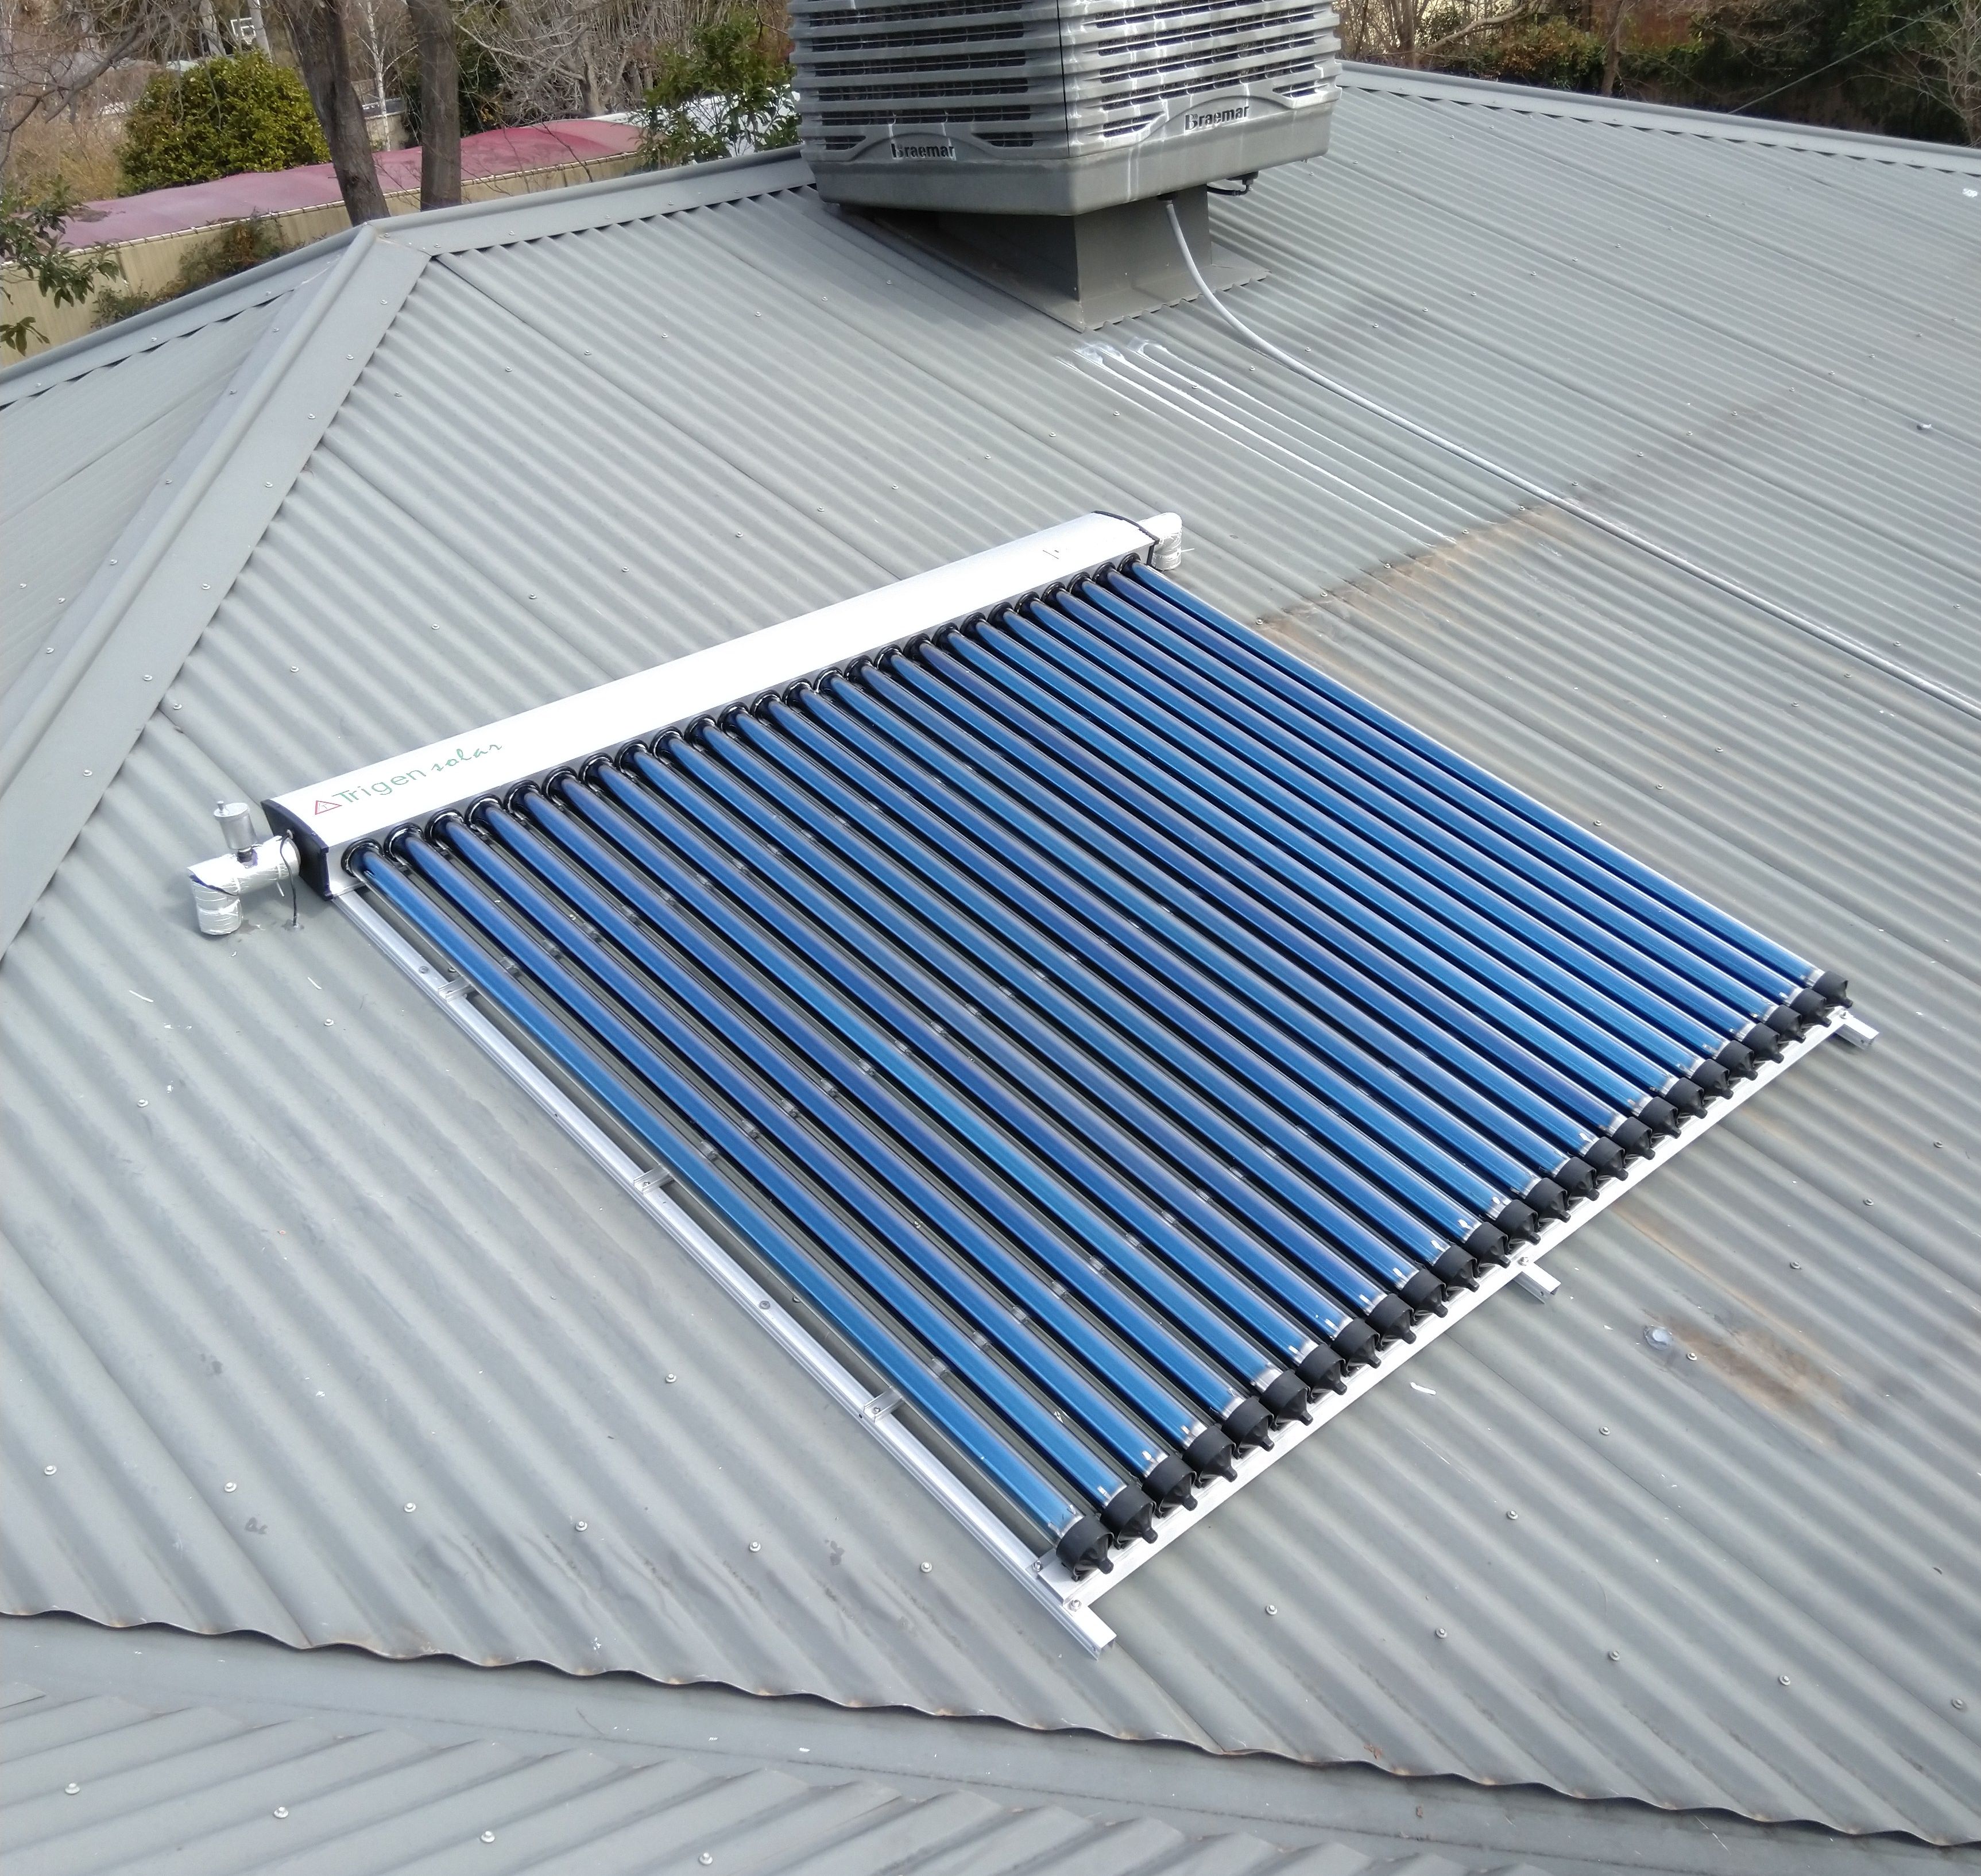 Photo of new the rooftop collector
After a couple of very hot summer days, we discovered that water stored in the tank had reached near boiling point. To avoid boiling the storage tank, the controller stopped pumping water through the collector. With the old flat plate collector system, this would have been fine as they can radiate heat back into the environment, but with the evacuated tubes the temperature in the collector rapidly climbed. The stagnant water in the collectors boiled off and turned to super-hot steam.
Of course, the system has a pressure relief valve to prevent the tank from turning into a bomb, but the damage was already done. The steam melted the pump impeller and all the plastic valves rated only to 100 ℃.
Clearly, a better solution was needed so that the same thing didnt happen again. The pump controller was not designed to handle the new type of collectors, and there was also no way to see what temperature the tank was currently at. If we had known earlier, we could have released some of the hot water to cool down the tank. Thus, I decided to re-design the controller and replace the existing one.
System Overview
The hot water system is relatively simple. Hot water is stored in a tank, cold water is fed in at the bottom and hot water is drawn from the top. The controller monitors the temperature at the top and bottom of the tank, as well as the temperature in the collector manifold. If the sun is shining, the collector heats up. When the controller detects that the collector temperature is high enough, it starts the pump, which pumps the cold tank water through the collector. The water heats up and then mixes back into the tank.
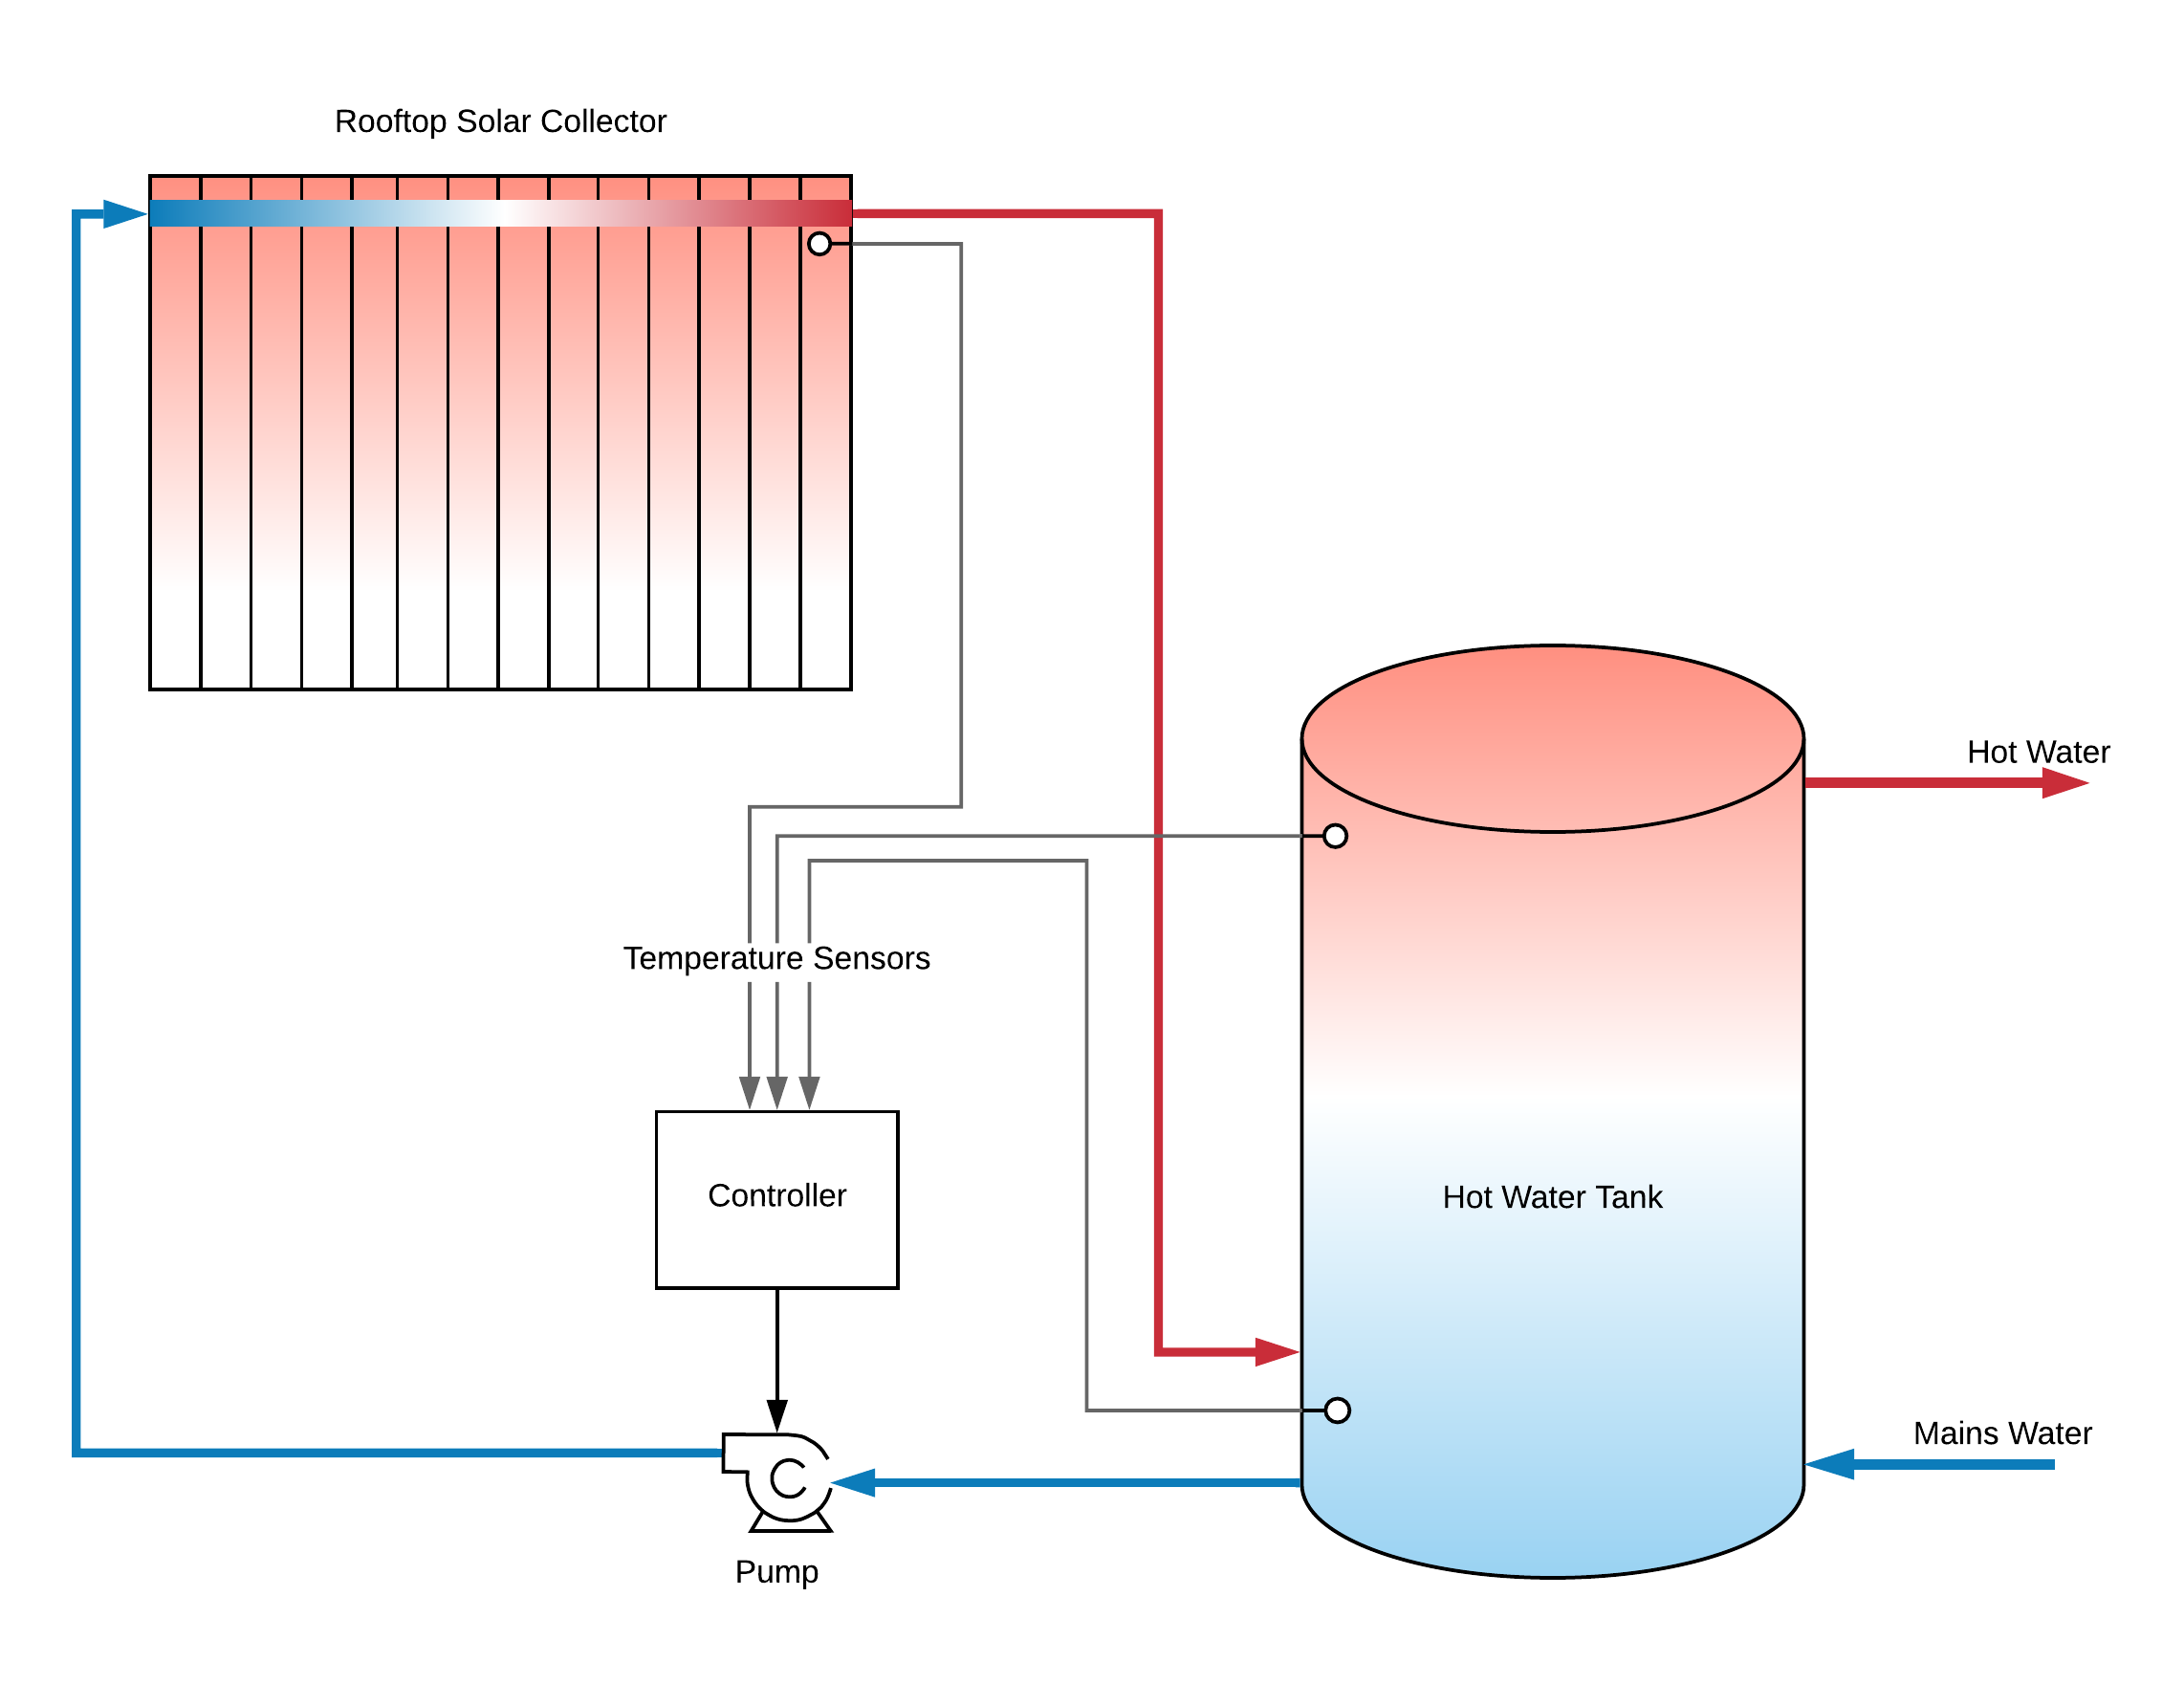 Diagram of the solar hot water system
For our new controller, we need to be able to do the following things
- Read the temperature from the 3 sensors in the system
- Decide when to turn the pump on and off
- Switch the pump on or off
- Display the current temperature and system status
- Alert someone when the temperature is too high
Hardware Design
The most challenging aspect of the design was figuring out how to read the temperature sensors. After a lot of googling, I eventually discovered that the sensors were PT1000 Resistance Temperature Detectors (RTDs). These sensors are simply resistors where the resistance is dependent on their temperature. They are called PT1000 sensors because they are made out of platinum, and have a resistance of 1000 Ω at 0 ℃. Their resistance increases roughly linearly with temperature, but it’s more accurate to use resistance tables or a quadratic fit.
We’ll be using the ESP32 as the microcontroller, but it can’t measure resistance directly. However, it does have an ADC which we can use to indirectly measure the resistance by measuring a voltage. We can use a voltage divider circuit and measure the output voltage. Knowing the input voltage and one of the resistors, we can figure out the value of the other resistor (the RTD we are trying to measure).
We use a 10 kΩ resistor and a 3.3 V input voltage, which means that at 0 ℃, the RTD will be 1000 Ω, and the output voltage will be 0.30 V. At 100 ℃, the RTD increases to 1385 Ω, giving 0.40 V at the output. However, our ADC is capable of reading values from 0 V to 3.3 V and only has 12 bits of precision. If we just read the voltage divider directly, we would loose precision in our temperature readings. To fix this, we can add in an instrumentation amplifier, to subtract a reference voltage and amplify the difference.
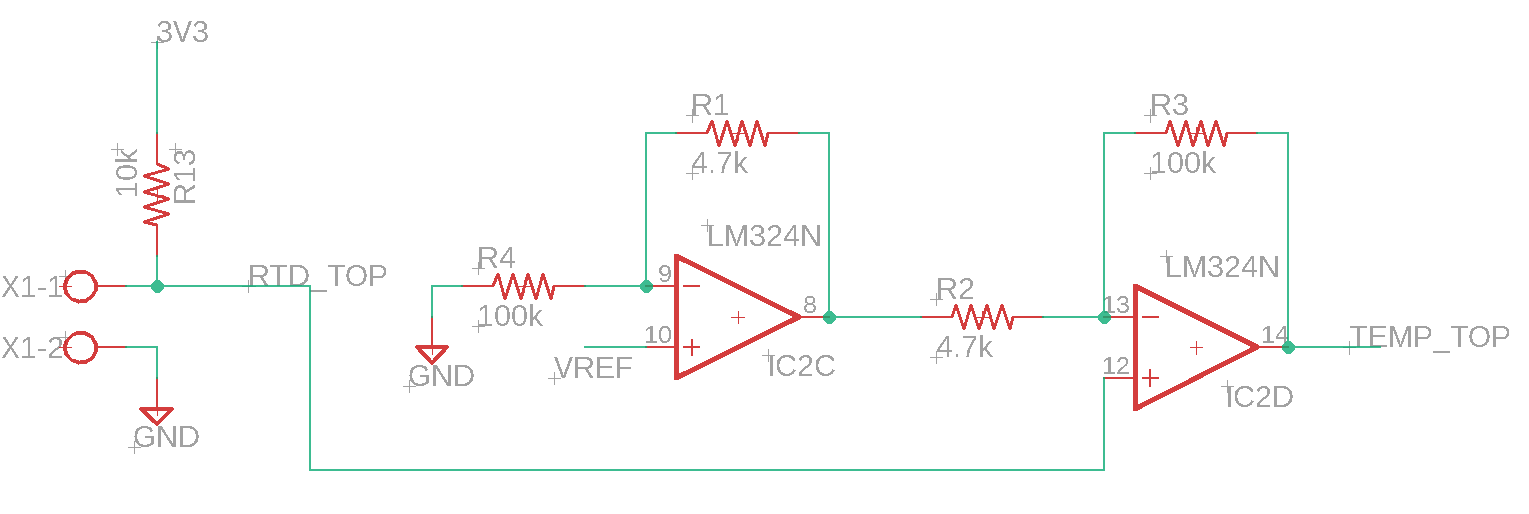 Instrumentation amplifier circuit for RTD sensing. The RTD is connected to the terminals on the left.
ADC Calibration
Despite our careful planning and circuit theory, the real world is never perfect. Imperfect tolerances in the resistance values and non-ideal characteristics of the opamps and the ADC means that we need to calibrate our circuit. To do this, I used a variable resistor in place of the RTD, which I could set to a specific resistance value using a multimeter. I then measured the ADC value for a number of resistance values in order to determine the relationship.
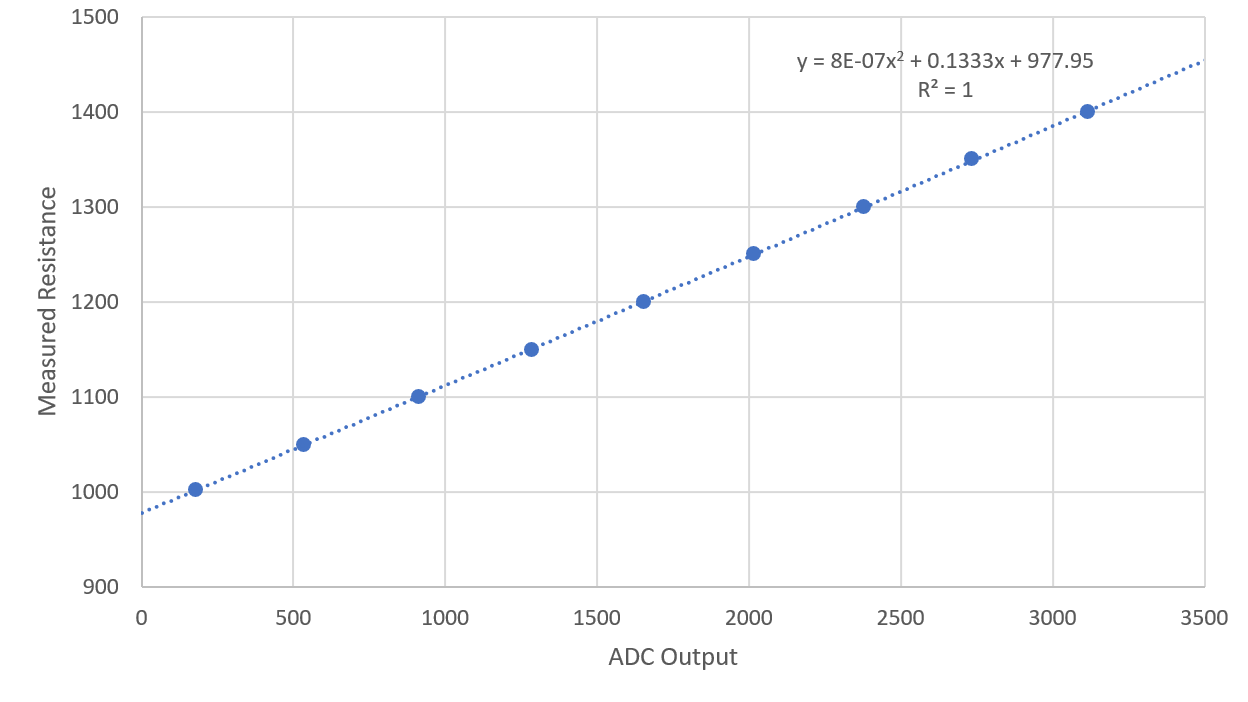
From this, we can use the trendline to calculate the resistance value from whatever ADC value we read from the ESP32.
Full Schematic Design
The rest of the schematic is relatively simple. We make 3 copies of the instrumentation amplifier to measure each temperature sensor individually. I also added a small OLED LCD display to show the current temperature. I also added a 240 V relay board to control the pump. The LCD is driven over I2C, and the relay just requires you to pull the wire to ground to activate the relay.
I also added some capacitors to reduce the noise in the RTD sensors. The RTD at the top of the collector is about 10m away, and the wire basically acts as a big antenna and introduces a lot of noise into the circuit. A big capacitor helps to smooth out the noise and gives more stable readings on the ADC.
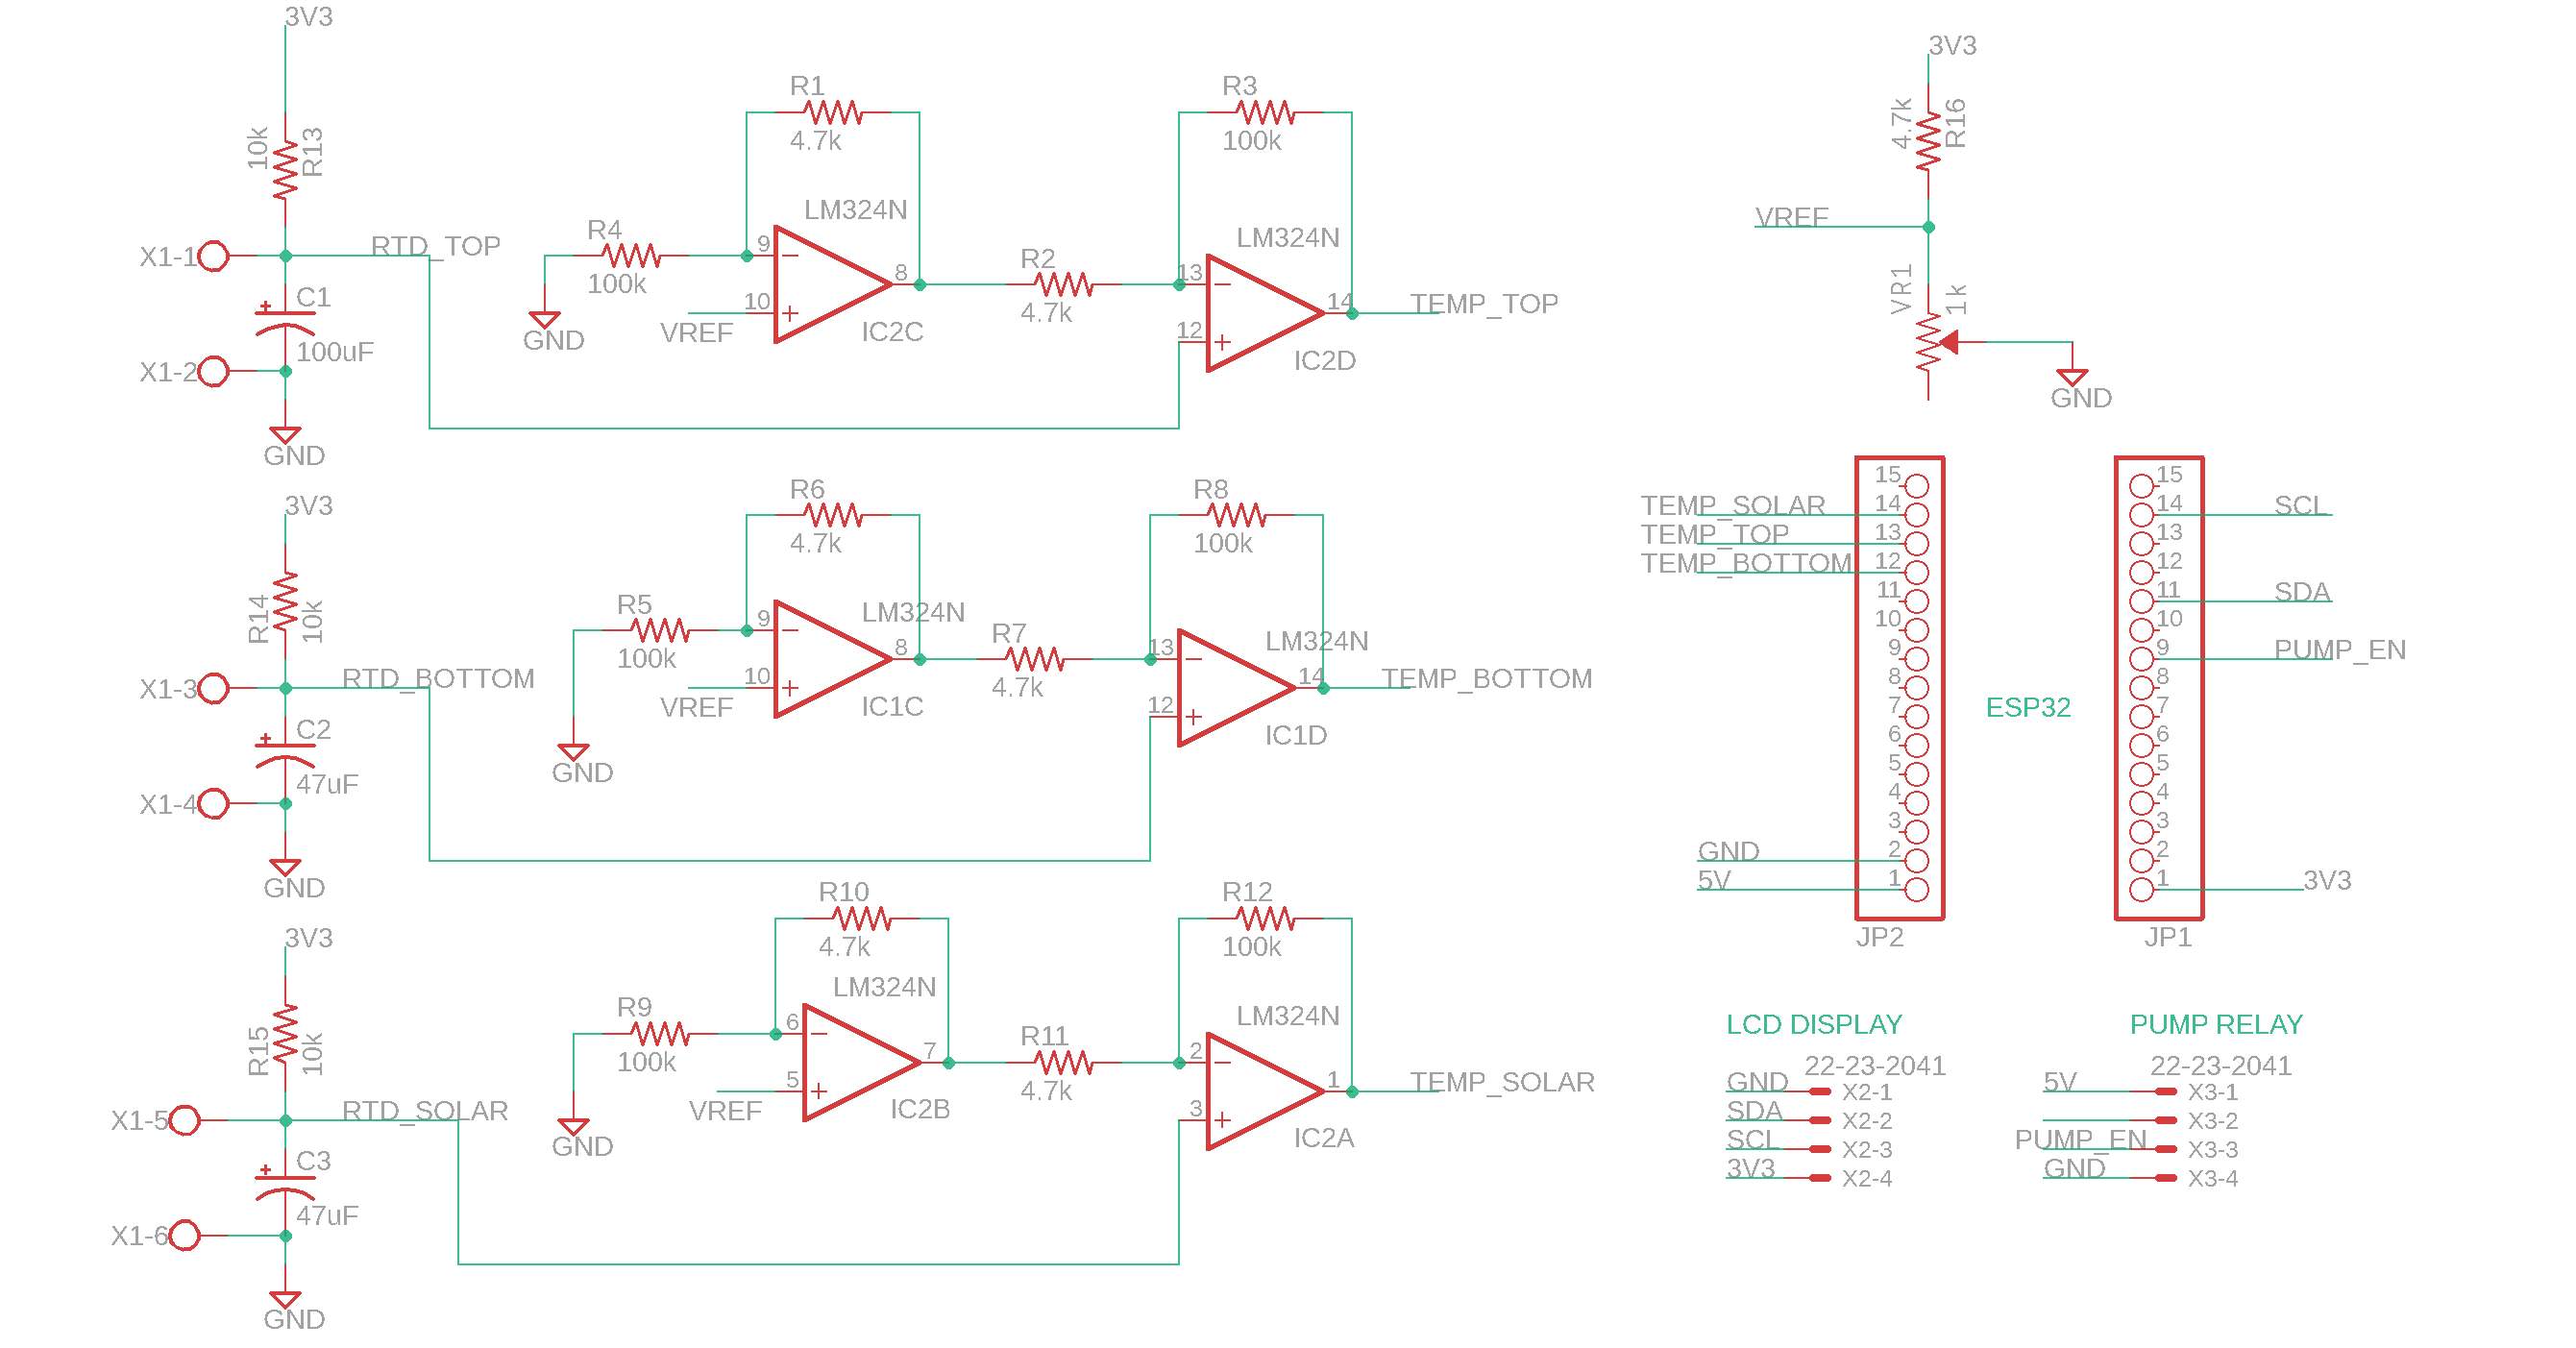 Final schematic of the circuit
After designing the schematic, I designed the board layout. I wasn’t going to get a custom circuit board fabricated, so I just used a perfboard and hand-soldered everything on.
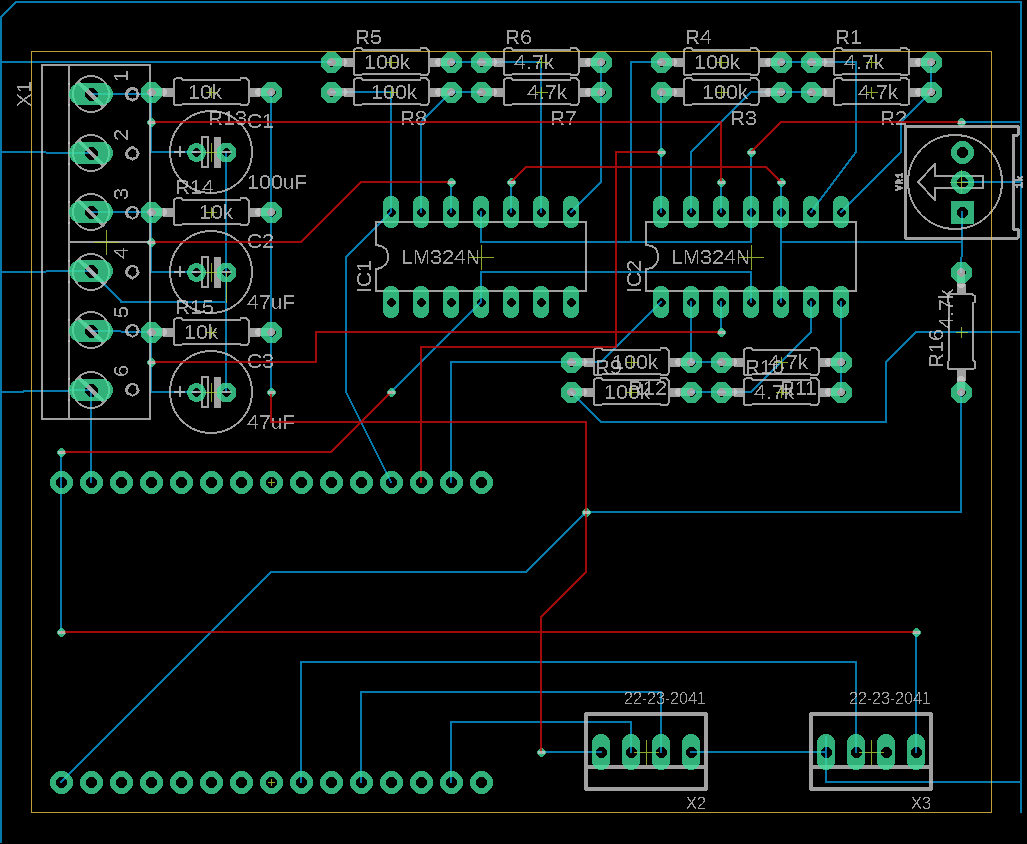 Physical layout of the circuit board
Overall, I’m pretty happy with how it turned out. Everything fits neatly and there’s even some room to spare.
Putting Everything Together
I reused the box the the old controller was in and managed to squeeze all of the required components in. I moulded some spare plastic to mount the LCD display which sits on top of the controller box. The three RTD sensors are connected in the bottom left, 5V power is supplied in the bottom right. The two cables on the right side are 240V mains power at the bottom and the power to the pump at the top. The mains is connected to the terminal block, through the relay board and then to the pump.
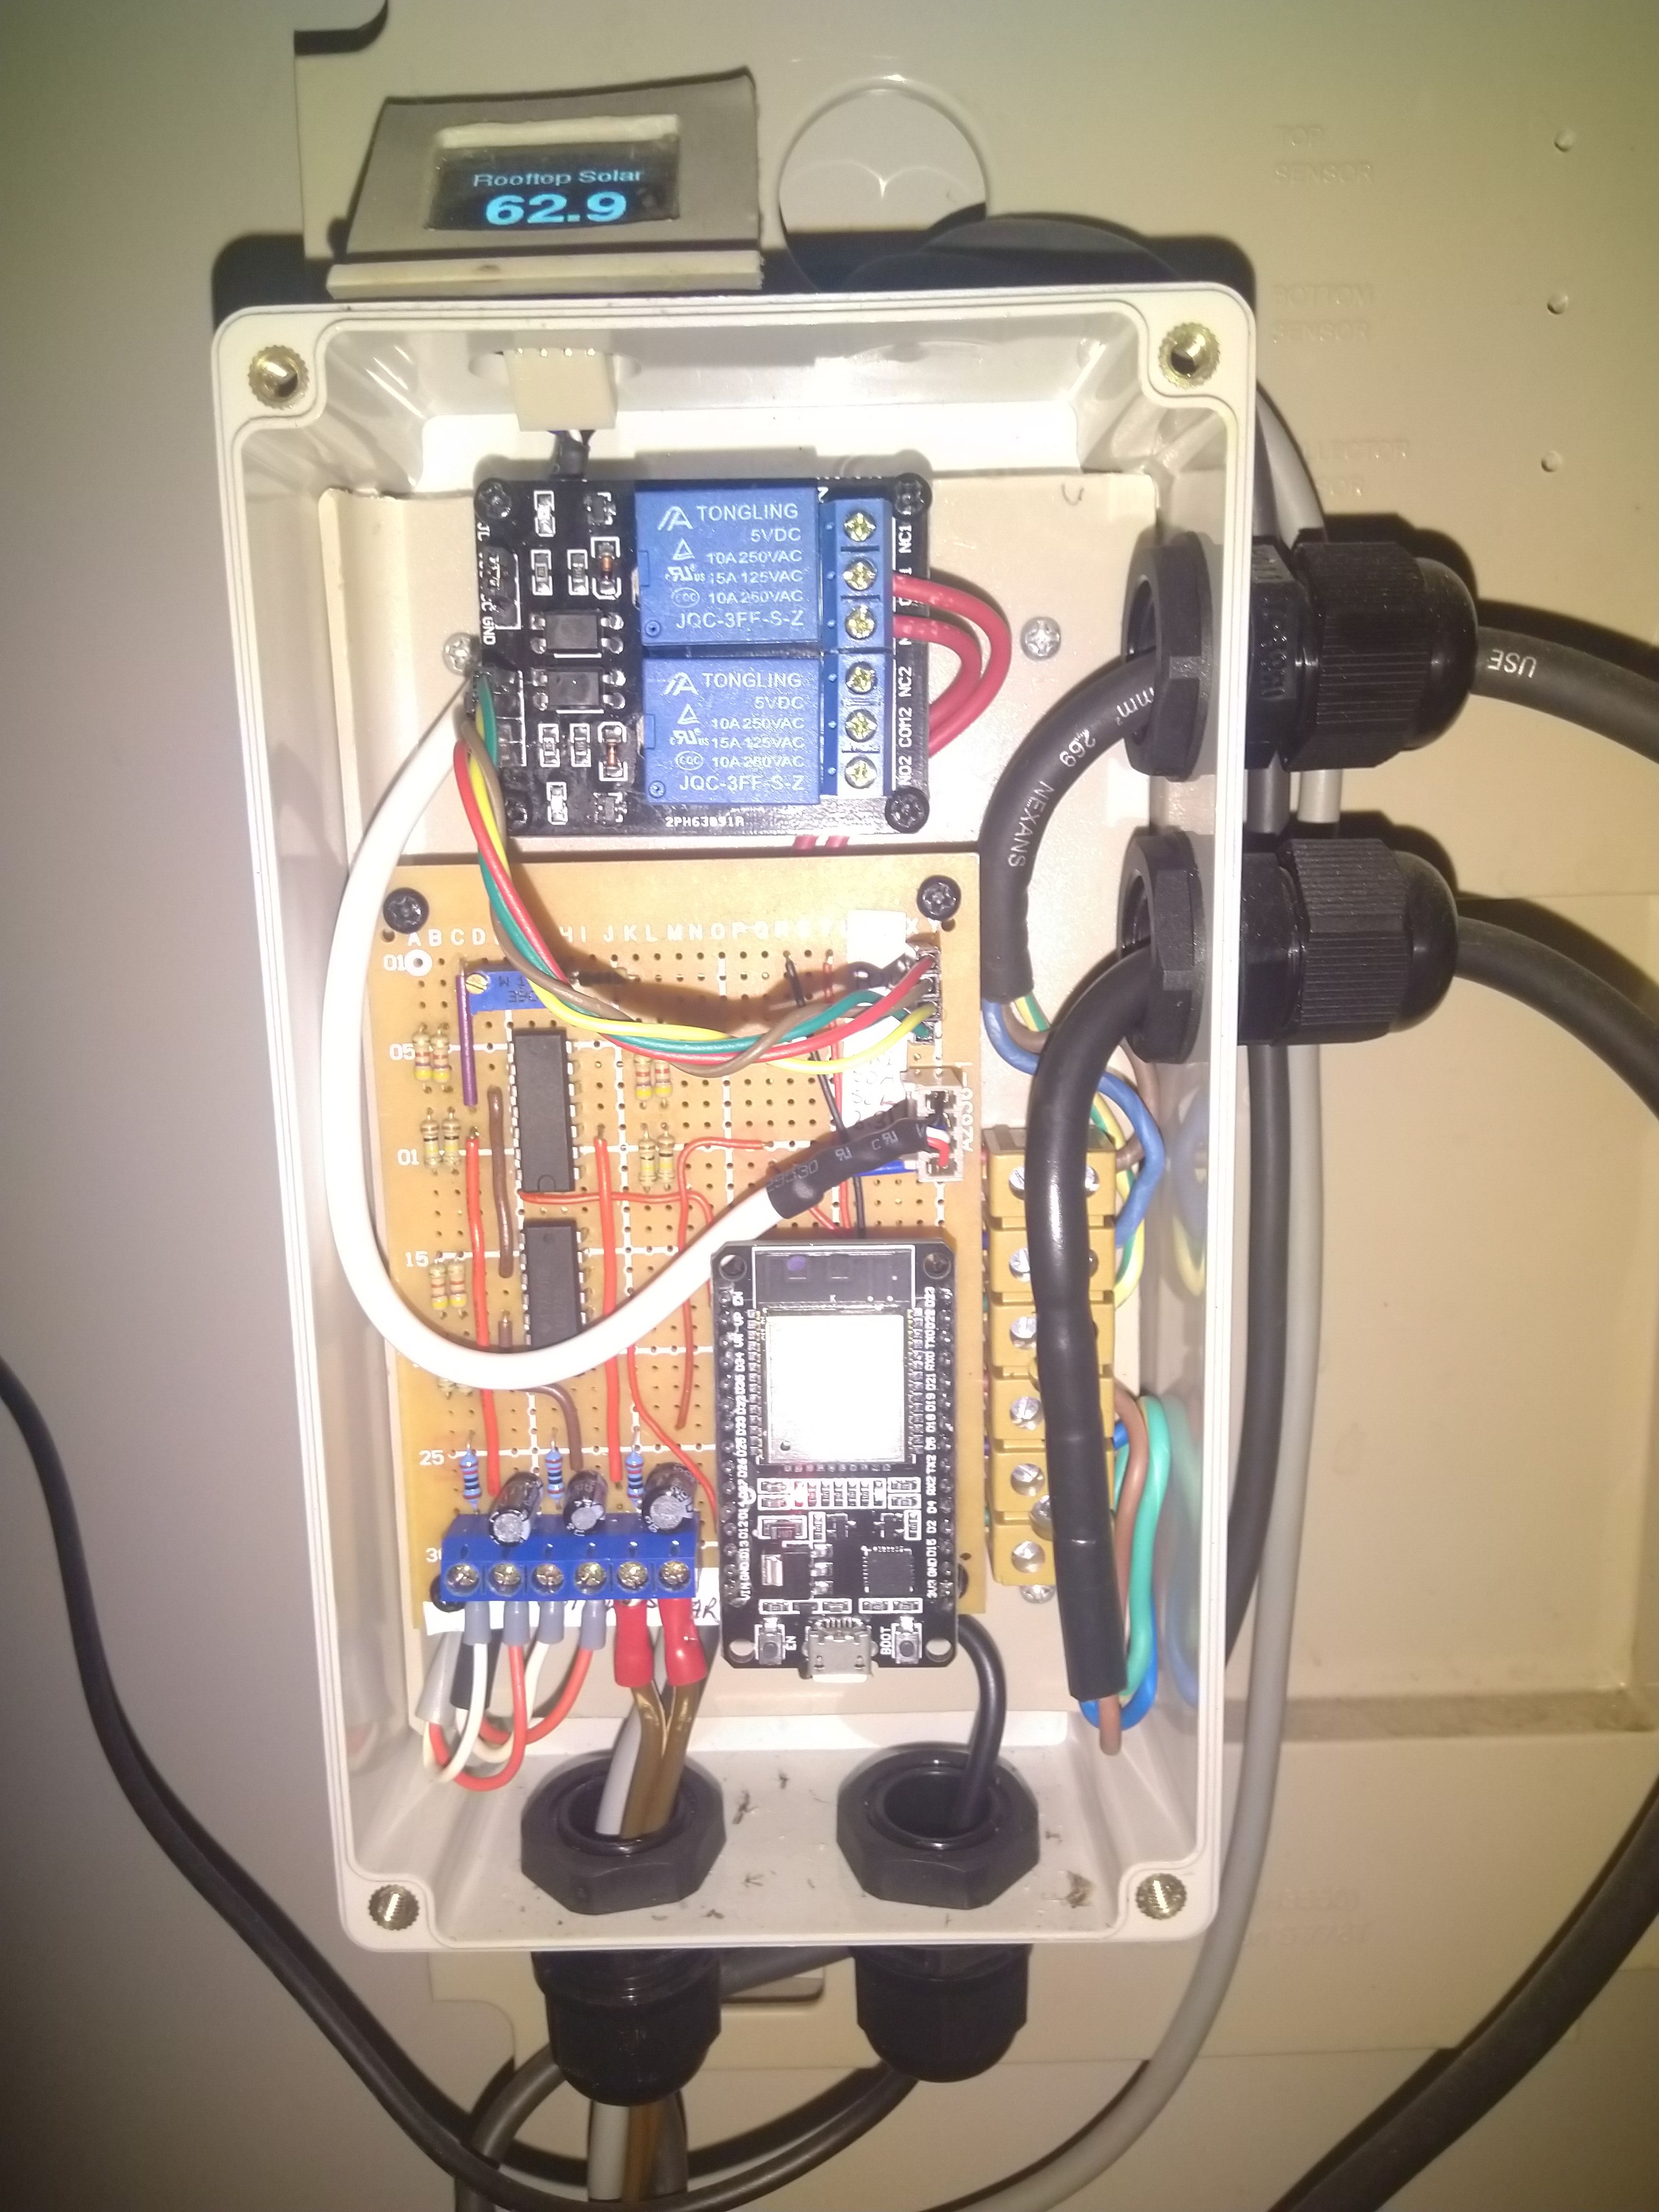 The final assembled controller
Software Design
I wrote up a program for the ESP32 using the Arduino framework and PlatformIO. The control loop is essentially:
- Read the RTD sensors and take the average of the last 20 readings.
- Update the display to show the current temperature or pump status
- Determine if the pump needs to be switched on or off
- Upload the current temperature and status to the cloud using MQTT
The decision to turn on the pump is modelled as a state machine with 4 different states:
- AUTO_OFF: The default mode
- AUTO_ON: If the collector is warmer than the bottom of the tank, the pump turns on and the collector heats up the water.
- AUTO_BOIL_PROTECT: If the collector temperature gets too high, the pump will circulate water to prevent the collector from boiling over. Human intervention might be needed to cool the tank down.
- AUTO_FREEZE_PROTECT: In the winter, if the collector temperature drops near zero, the pump will turn on to circulate warmer water through the collector to prevent the manifold from freezing.
PumpMode get_next_mode(SystemStatus status){
  switch(current_mode){
    case PumpMode::AUTO_BOIL_PROTECT:
      if(status.temperature_solar < boil_protect_off){
        // Solar has cooled down below the threshold
        return PumpMode::AUTO_OFF;
      } else {
        // Solar is still above the boiling threshold
        return PumpMode::AUTO_BOIL_PROTECT;
      }

    case PumpMode::AUTO_FREEZE_PROTECT:
      if(status.temperature_solar > freeze_protect_off){
        // Solar has warmed up above the threshold
        return PumpMode::AUTO_OFF;
      } else {
        // Solar is below freezing threshold
        return PumpMode::AUTO_FREEZE_PROTECT;
      }

    case PumpMode::AUTO_ON:
      if(status.temperature_solar - status.temperature_bottom < solar_temp_difference_off){
        // Solar is no longer above the required threshold
        return PumpMode::AUTO_OFF;
      } else {
        return PumpMode::AUTO_ON;
      }

    case PumpMode::AUTO_OFF:
      if (status.temperature_solar - status.temperature_bottom > solar_temp_difference_on){
        // Normal Operation - Solar is hotter than the tank, turn pump on
        return PumpMode::AUTO_ON;
      } else if (status.temperature_solar > boil_protect_on){
        // Turn on pump so solar does not boil
        return PumpMode::AUTO_BOIL_PROTECT;
      } else if (status.temperature_solar < freeze_protect_on) {
        // Turn on pump so solar does not freeze over
        return PumpMode::AUTO_FREEZE_PROTECT;
      } else {
        // Nothing Changed
        return PumpMode::AUTO_OFF;
      }
    default:
      return PumpMode::AUTO_OFF;
  }
}
Graphing the data
The information collected from the controller is uploaded every minute using the MQTT protocol. I originally used the Cloud4Rpi service, but have since moved to a self-hosted InfluxDB and Grafana server.
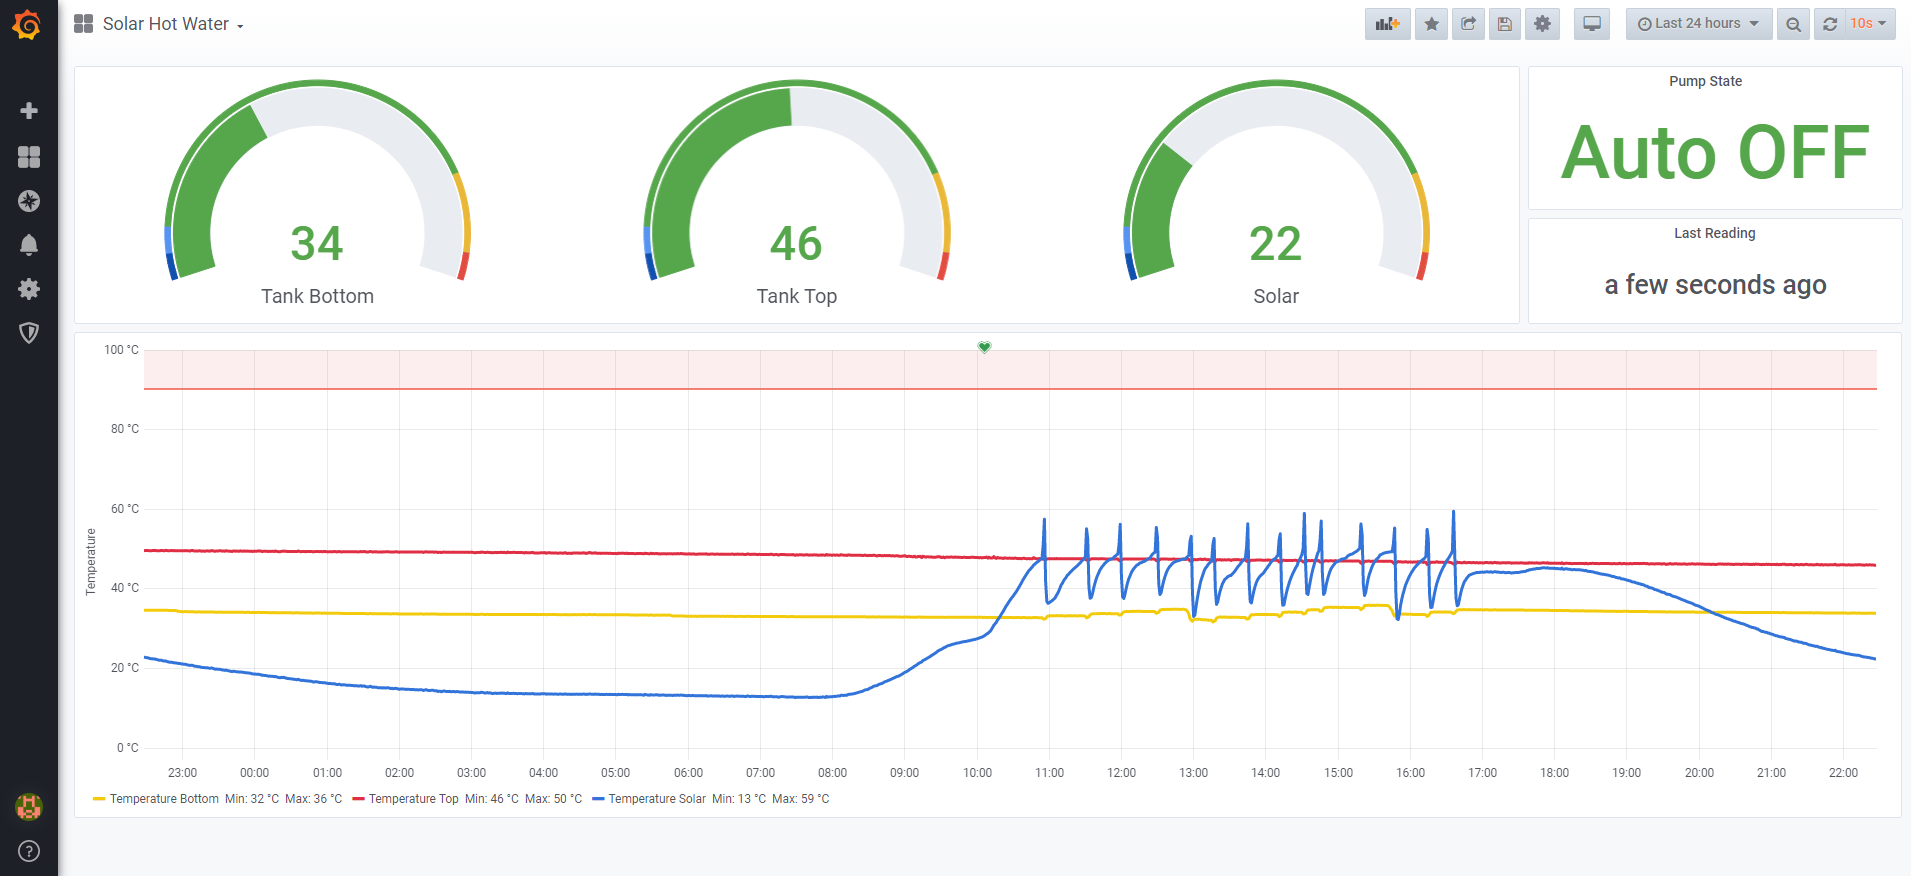 Grafana dashboard showing the system status
The dashboard shows the current temperatures, the current state of the pump and a history of the temperature over time. You can see the collector temperature (in blue) warm up in the morning until the pump turns on and the collector is flushed with cooler water. Shortly after the pump turns off and the collector starts to heat up again. The graph shown above is of a particularly cloudy day where the collector doesn’t heat up very much.
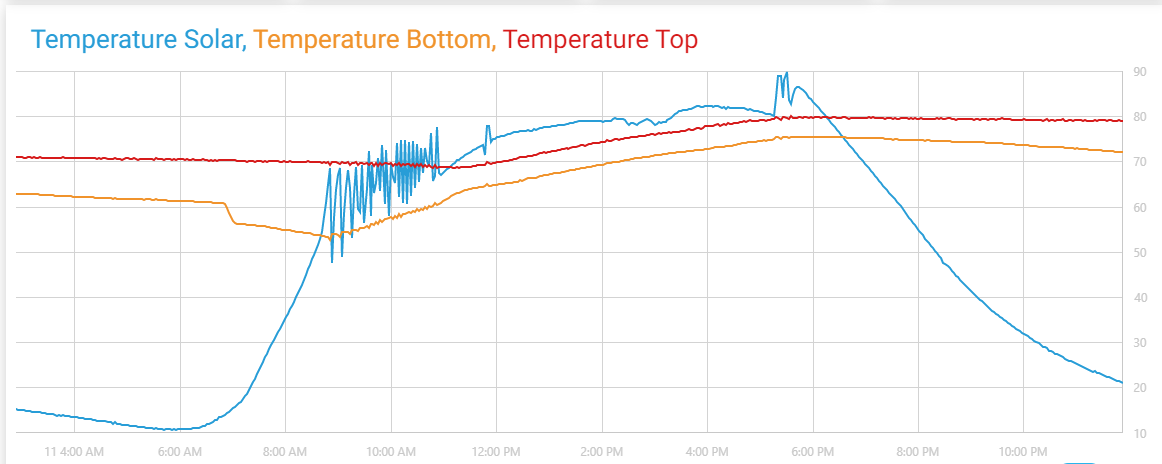 Example of a typical day in summer
The graph above is from the old Cloud4Rpi dashboard, but shows a typical summer’s day. In the middle of the day, the pump is continuously running and the tank temperature starts to rise.
Freeze Protection
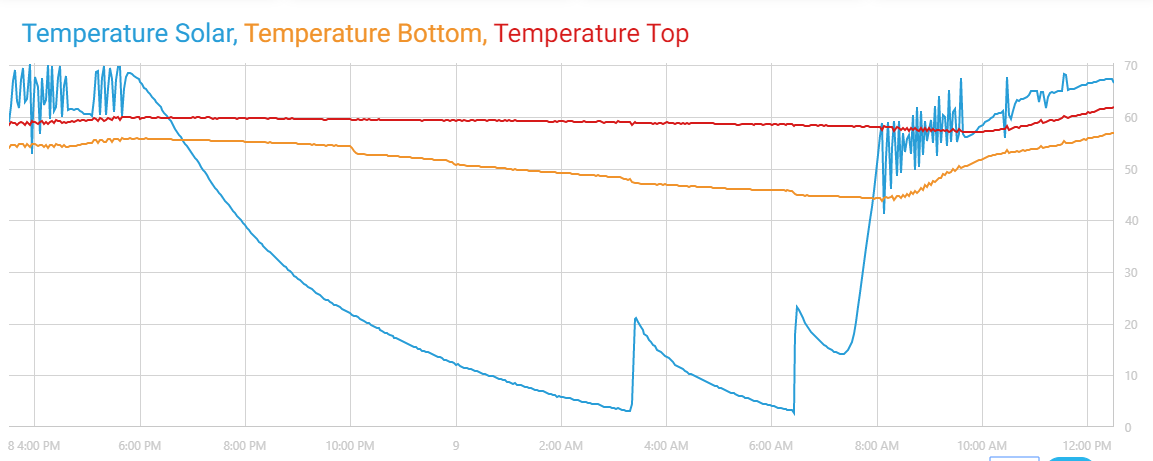 Example of how freeze protect works
This graph shows an example of the freeze protection. The solar collector temperature slowly cools down overnight until the pump turns on to raise the temperature back up. At the same point you can see a slight dip in the temperature of the bottom of the tank because of the freezing cold water being pumped in.
Wrapping Up
Overall, this project has been very successful. The new controller is much better, more customisable and provides more information about the system. It was also a fun and enjoyable engineering project helping me to build my electronics skills and experience.