
Clock Synchronisation over Wi-Fi Networks
In this report, I will be discussing clock synchronisation, why we need it, how I implemented it, and some potential issues when synchronising over Wi-Fi networks.
Introduction
During the course of my PhD research I needed to collect some experimental data to verify and validate the multi-robot collaborative localisation algorithms I was developing. In the lab, we have a number of UGVs (Unmanned Ground Vehicles) as well as several UAVs (Unmanned Aerial Vehicles) each equipped with IMU (Inertial Measurement Unit), UWB (Ultra Wide-band), and cameras.
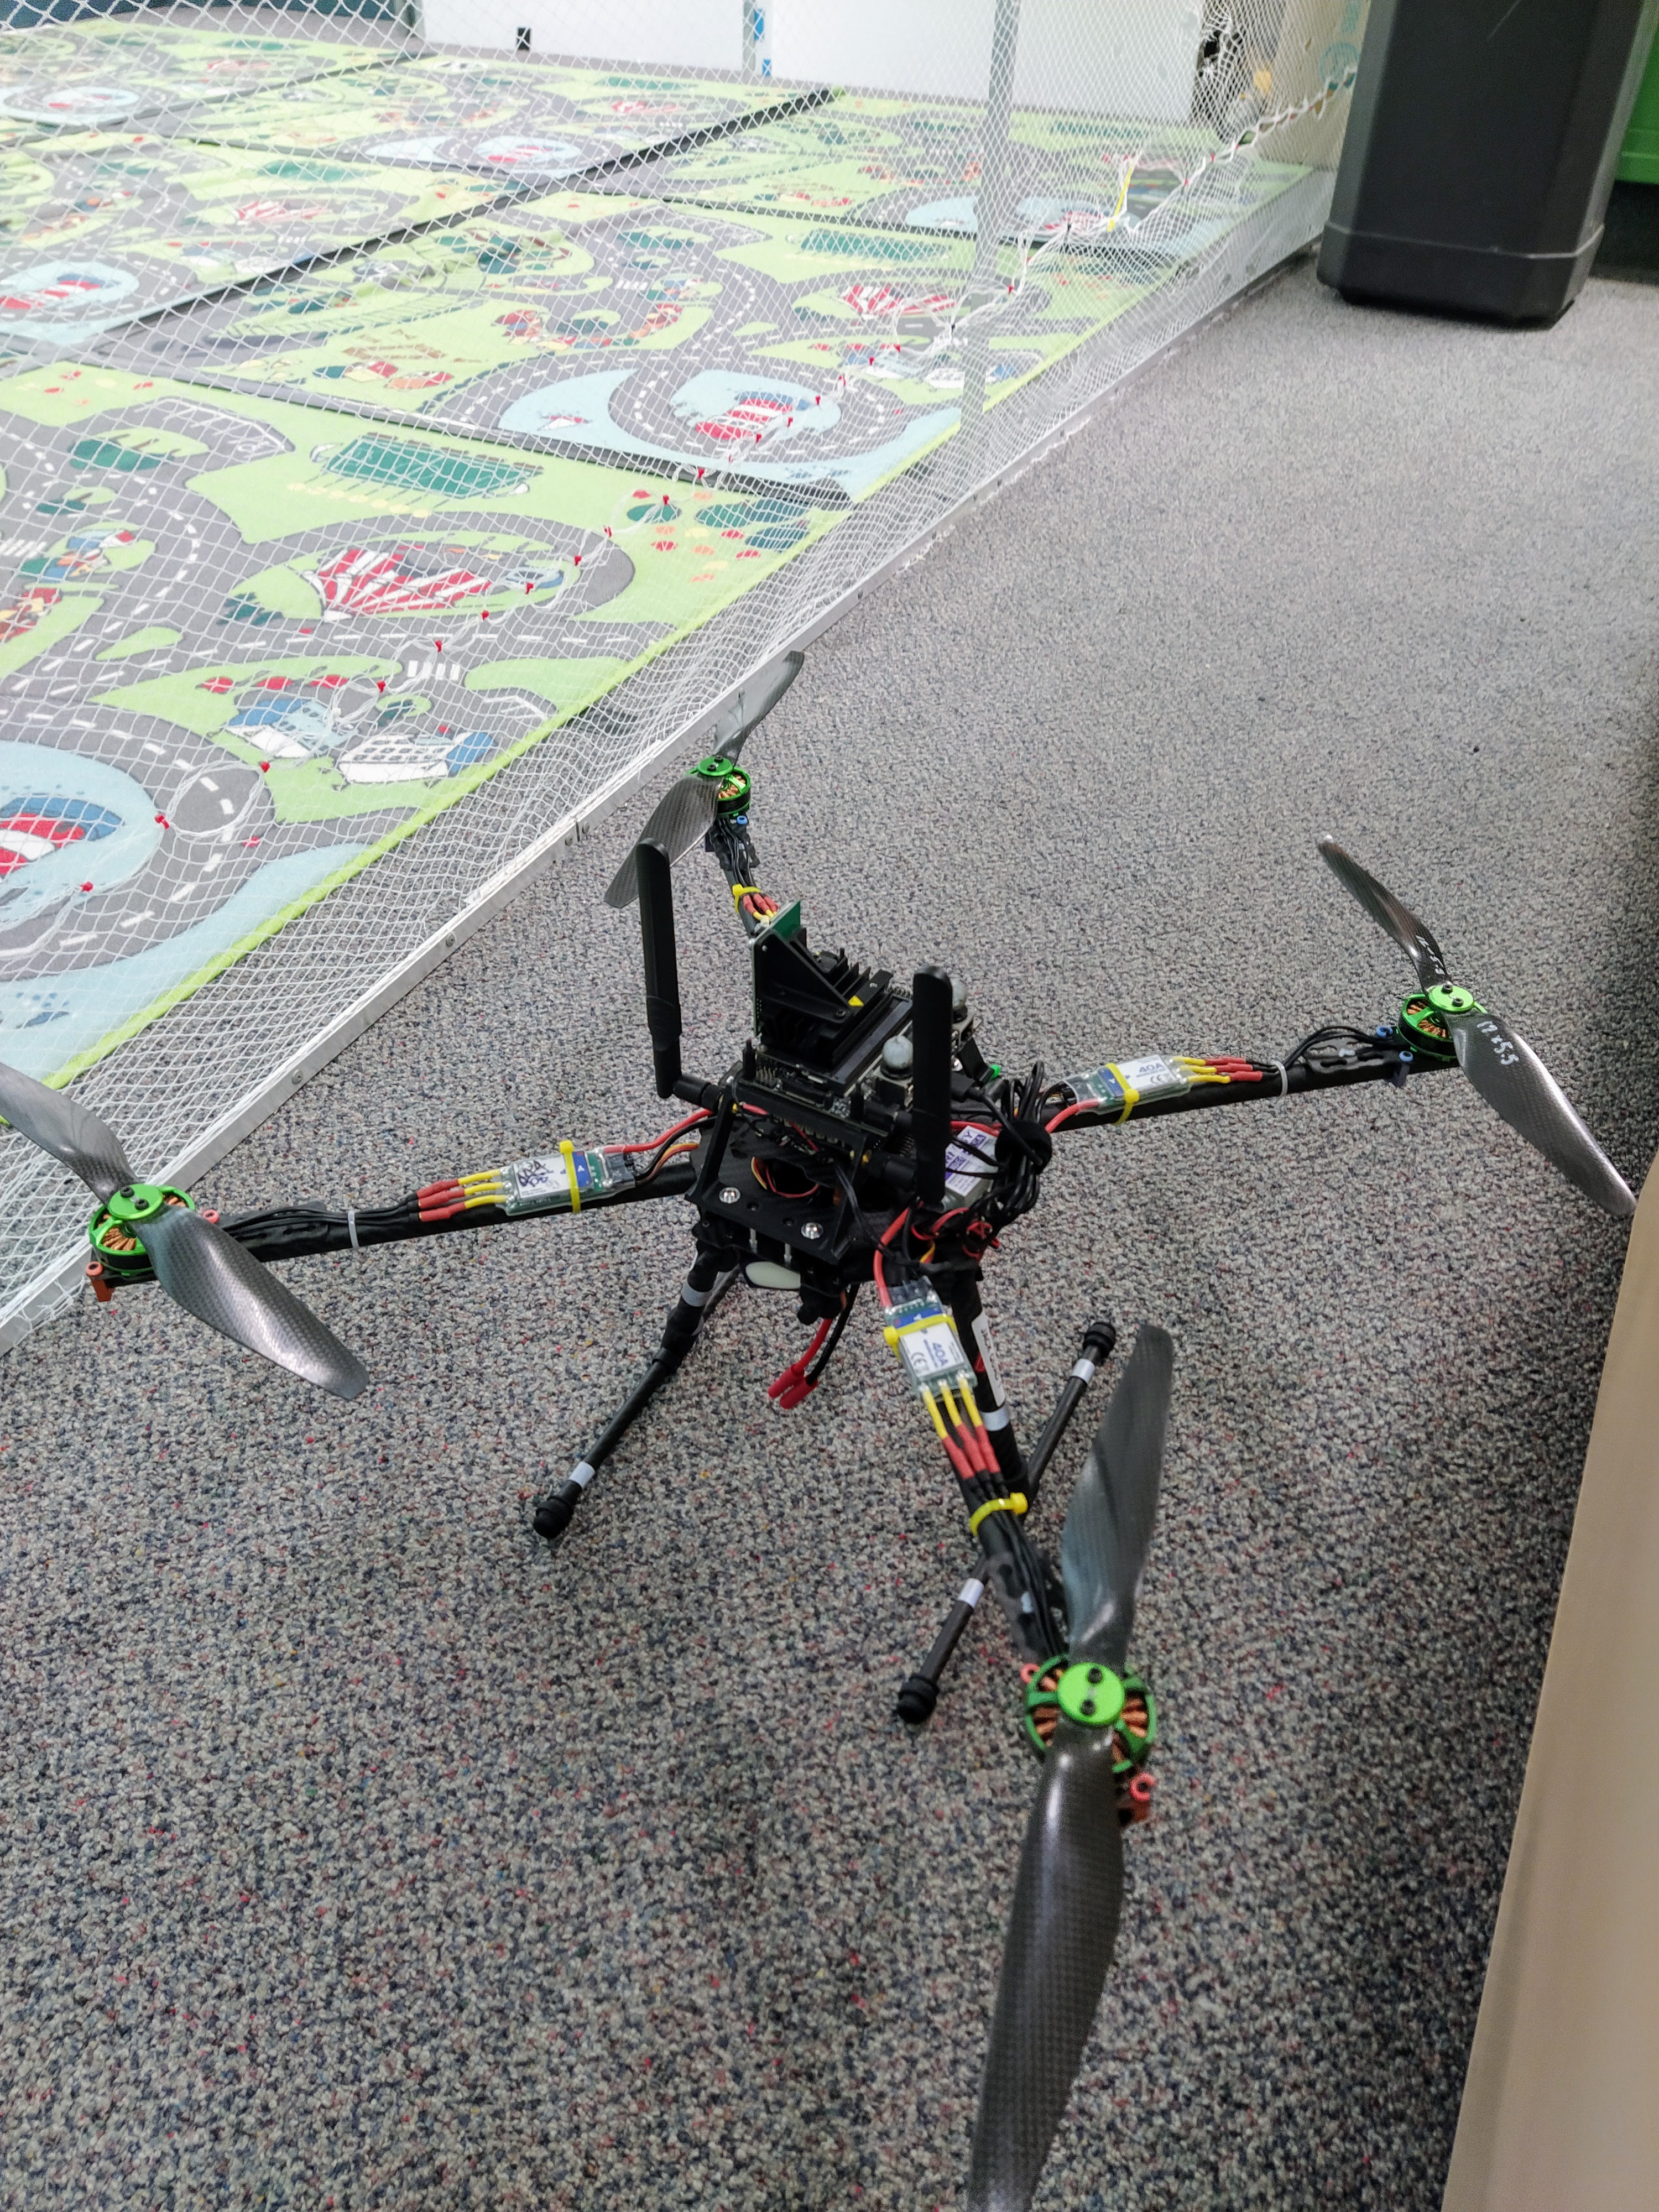
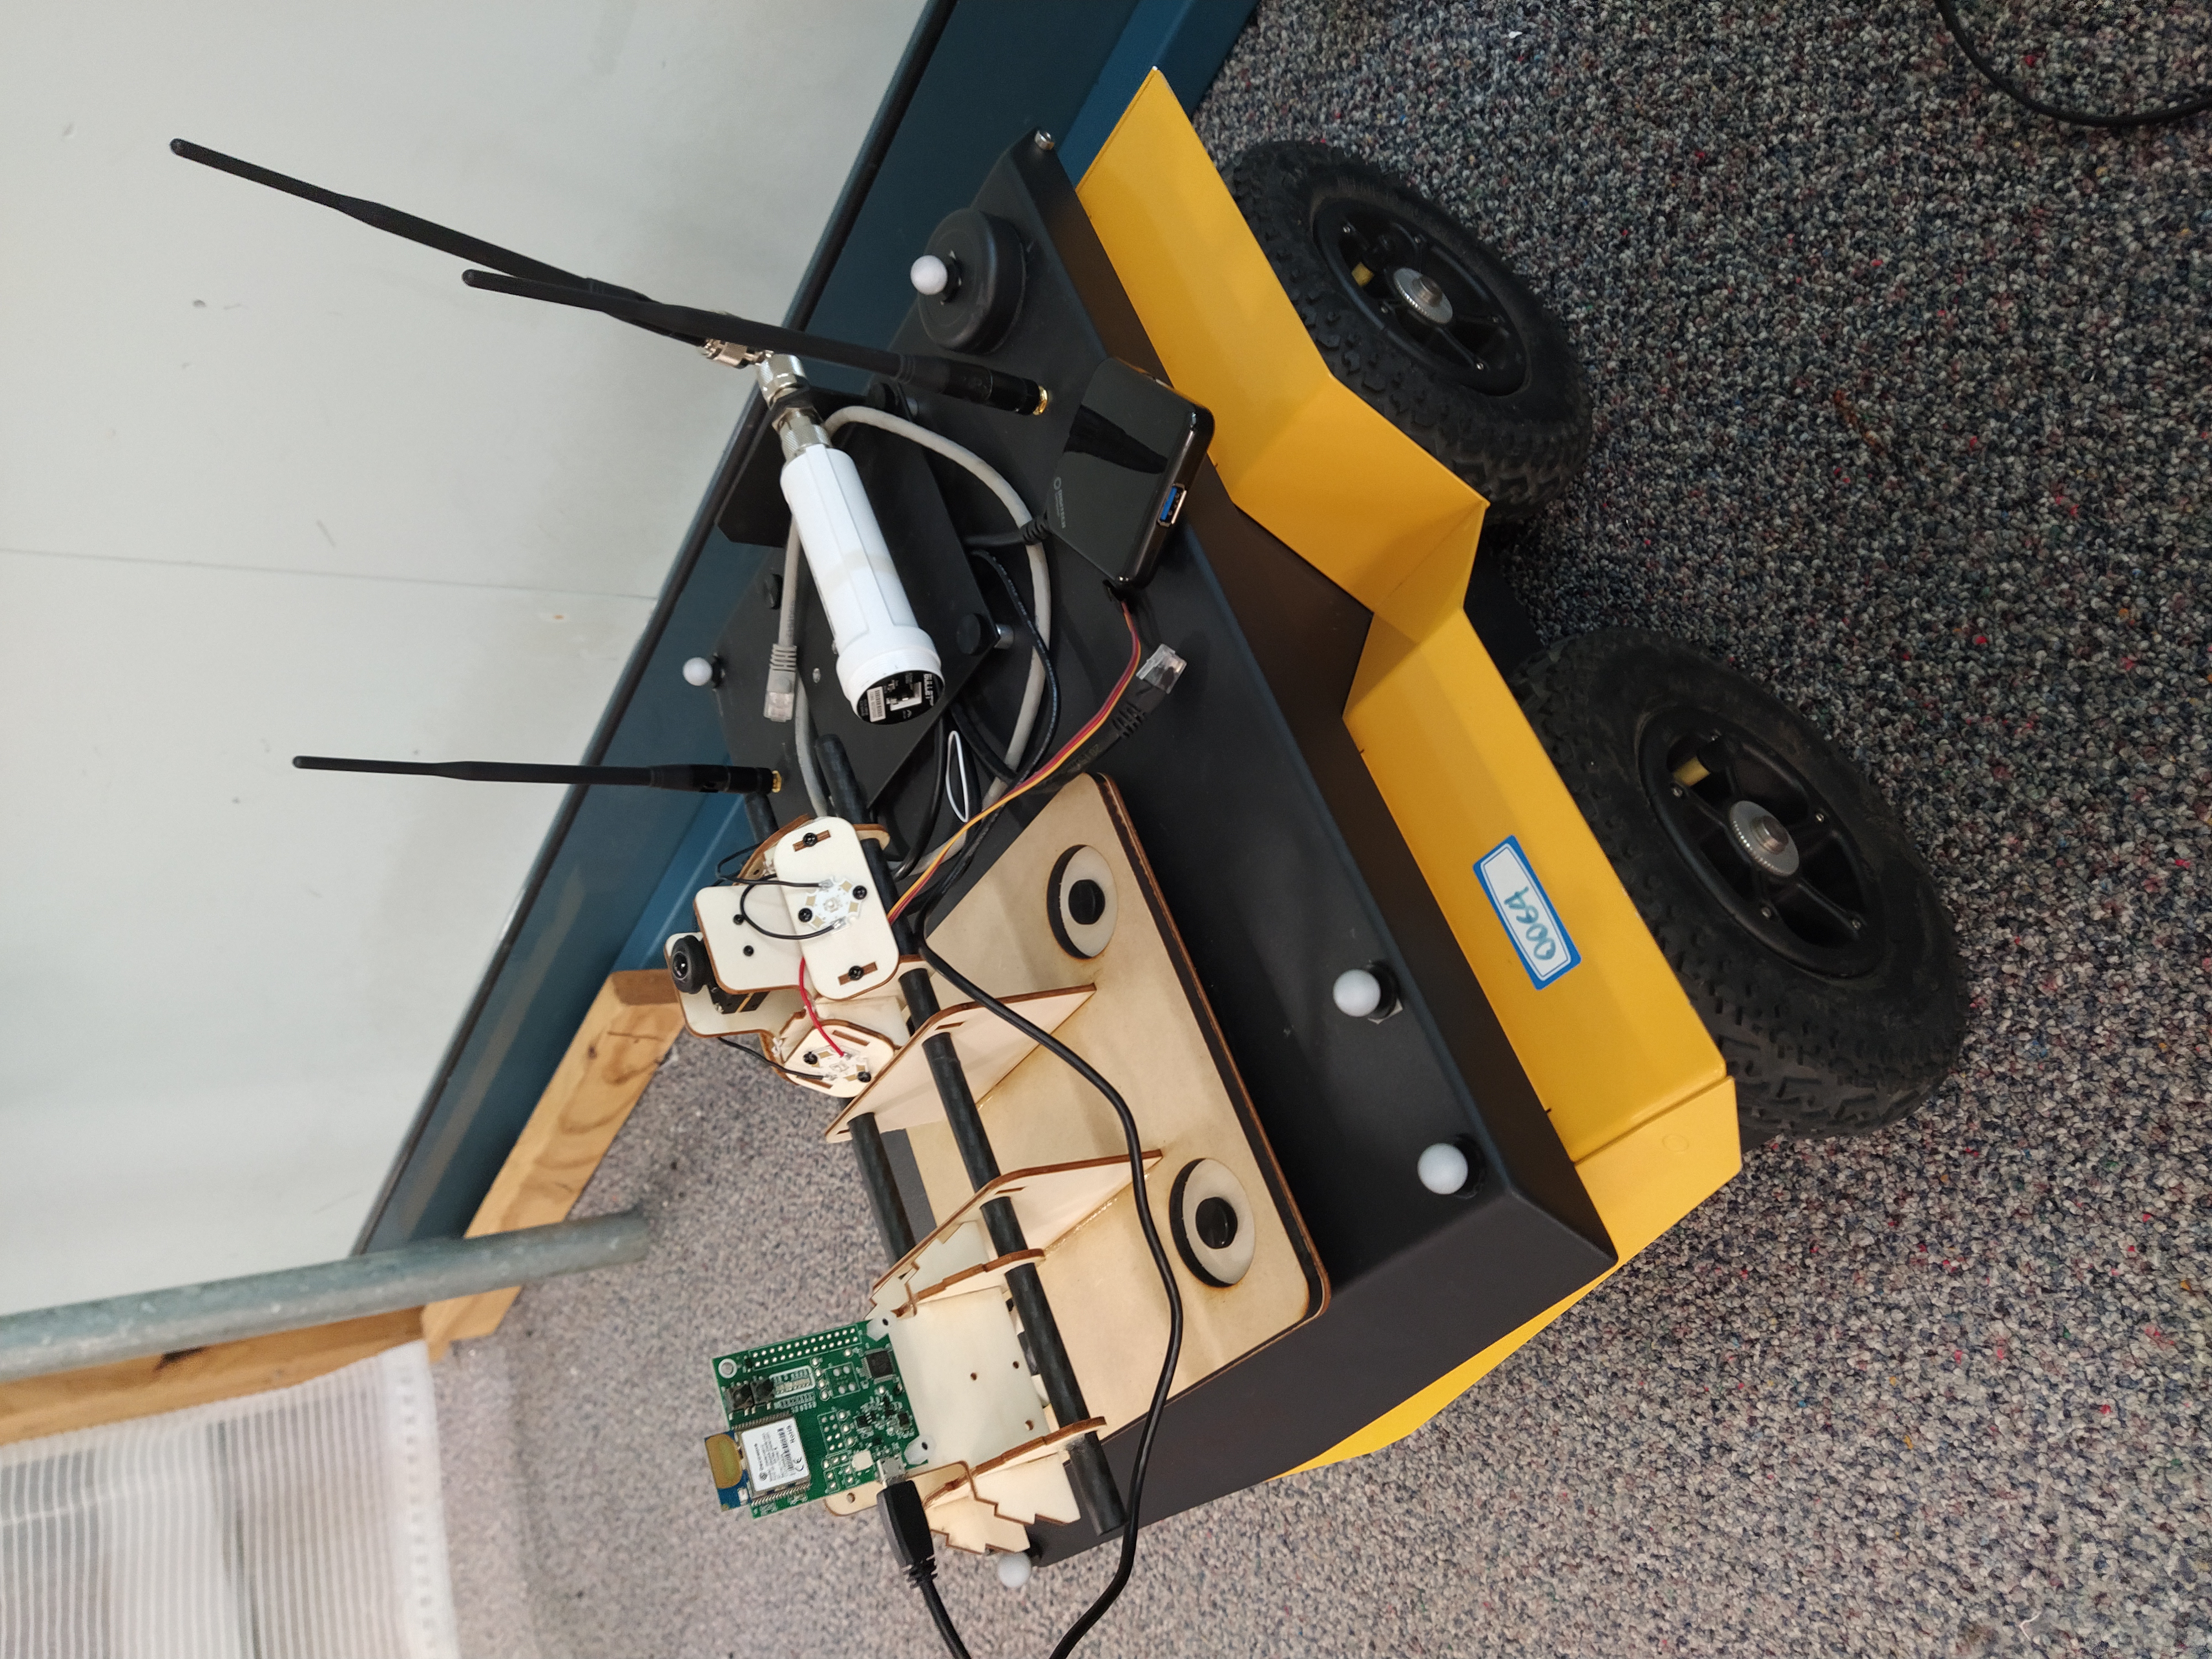 The UAV and UGV used for experimental work
To create a dataset to test the algorithms, we needed to drive/fly all the vehicles around in the same space at the same time and then collect the sensor data from each vehicle. Each vehicle’s onboard computer is running ROS, the Robot Operating System, which provides a standardised way to manage all the different sensors and processing systems. We also have a VICON motion capture system in the lab which provides us with the ground-truth position information for each vehicle.
Why we need to synchronise clocks
One major problem that arises when dealing with multi-vehicle networks is time synchronisation. Each vehicle has an onboard clock which provides the timestamp every sensor measurement made by the robot. If we want to compare sensor measurements between vehicles, or compare a vehicle’s estimated position to the ground-truth VICON position, we need to ensure that the measurements we are comparing were made at the exact same physical time. Given that each onboard clock is measuring a different time, we either need to ensure that each clock is synchronised, or we need to have some way to match up measurements timestamped with different clocks. With measurement data being recorded at more than 200Hz for some sensors, sub-millisecond precision is necessary to ensure data is accurately recorded.
There are two different factors that need to be accounted for when synchronising clocks, offset and drift. The offset is simply the difference between the times reported by each clock. For example, at a particular point in time, Clock A might read 10:00:00, while Clock B might read 10:00:23. Thus, there is a 23-second offset between the clocks.
However, an hour later, Clock A might read 11:00:00, while clock B reads 11:00:26. It has gained an additional offset of 3 seconds. Temperature fluctuations can cause the clocks to tick faster or slower which causes drift. For example, in one hour, Clock A may tick 3 seconds faster compared to Clock B, but in the next hour, it may be 2 seconds slower. This variation means that even if you synchronise two clocks at one point in time they will slowly drift out of synchronisation. It is not a ‘set and forget’ calibration.
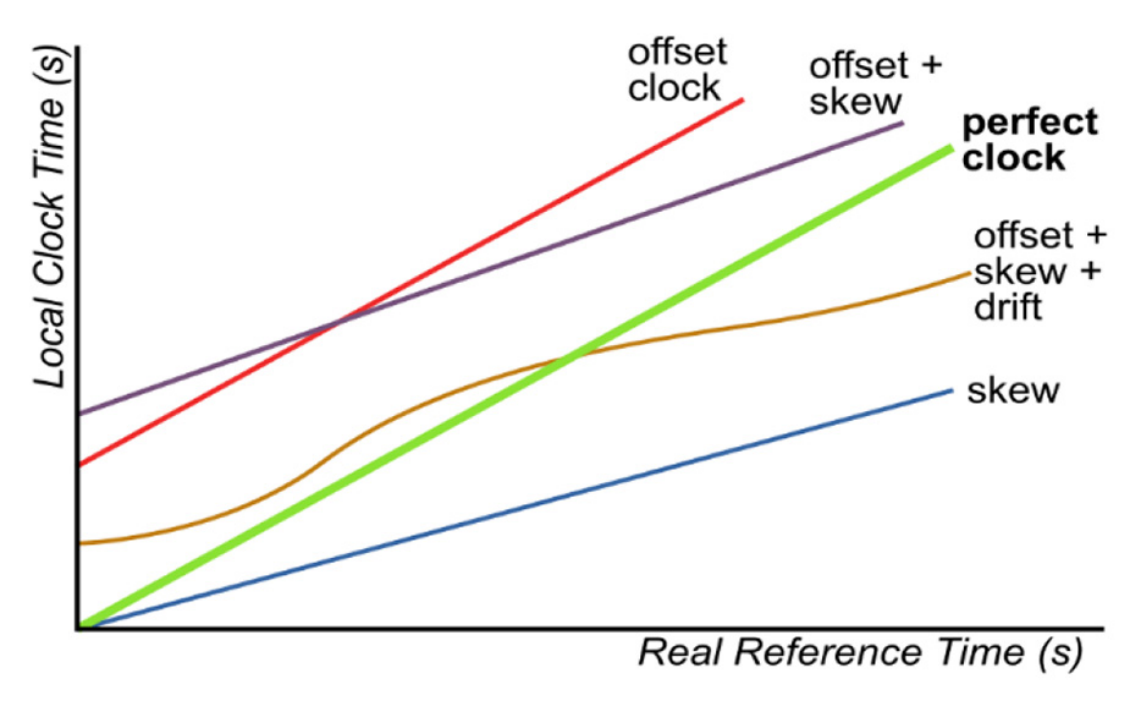
Example of clock offset and drift. Source
Methods for Clock Synchronisation
For our data collection experiment we have two options for synchronisation, either real-time or post-processed. Post-processing tries to determine the clock offset by analysing the data after it has been recorded. The EuRoC dataset is an example of this method. The IMU measurements onboard the vehicle are temporally aligned with the ground-truth VICON measurements using a maximum likelihood estimator. This requires a significant amount of processing, and also means that the data is not fully independent of the ground truth.
Real-time methods attempt to adjust the clocks so that they as closely aligned as possible, thus measurements recorded on different vehicles will be correctly timestamped with a common shared time reference. One common way to achieve this is by using GPS/GNSS. The GPS system transmits a high-precision timestamp as part of how the system determines your location, and this can be used as a time source. However, indoors this is not so useful as the signal is too weak.
Another common way to achieve synchronisation is through the internet, via the Network Time Protocol (NTP). There are two issues with NTP for our particular use case; 1) the typical accuracy of synchronisation over the internet is approximately 10ms, 2) The network in the lab is not connected to the internet. While I could create a local NTP server, I have found the configuration to be not very straightforward.
A better solution which is more closely aligned with our requirements is the Precision Time Protocol (PTP). It is specifically designed for high-precision time synchronisation on local networks and is theoretically capable of sub-microsecond accuracy - significantly better than our requirements. It is also fairly simple to implement and configure.
The main challenge with network-based synchronisation is latency. There is always some delay when transmitting information between the two clocks. In a local network is can be on the order of 10’s of milliseconds, but what is more relevant is the variability in the latency, also known as jitter. If there is a high level of jitter, then it is difficult to estimate the true delay, and synchronisation will be less accurate.
Configuring PTP
This section contains a brief guide on how I configured the PTP synchronisation for the lab network. Each computer is running either Ubuntu 18.04 or 20.04 with ROS installed (although this is not required). We will designate the ground-station laptop as the ‘master clock’ and all other computers on the network will synchronise their time to this clock. It doesn’t necessarily matter whether the time on the master clock is accurate or not, as long as there is a single common reference time.
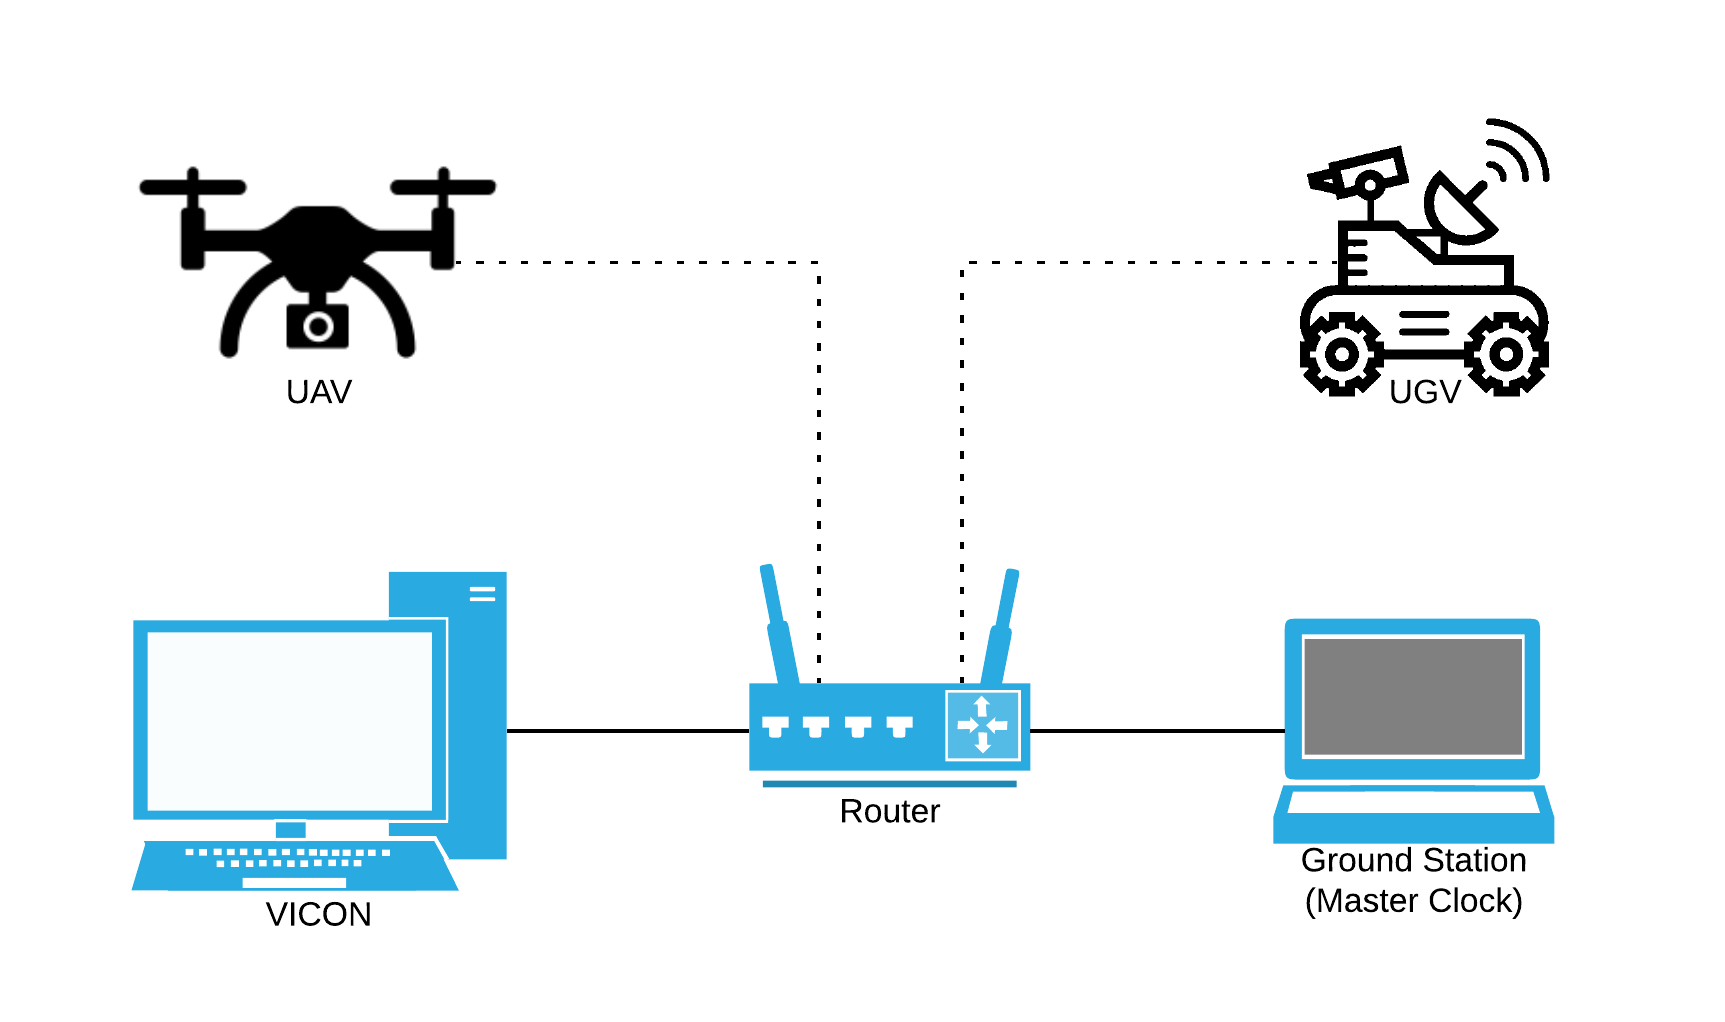
Network diagram of the setup in the lab
On each computer we run
sudo apt install ptpd
Edit the file /etc/default/ptpd to include
START_DAEMON=yes
PTPD_OPTS="-c /etc/ptpd.conf"
On the master computer, create a new file /etc/ptpd.conf
; /etc/ptpd.conf for Master

; interface has to be specified
ptpengine:interface=enp0s31f6

; PTP domain
ptpengine:domain=42

; available presets are slaveonly, masteronly and masterslave (full IEEE 1588 implementation)
ptpengine:preset=masteronly

; multicast for both sync and delay requests - use hybrid for unicast delay requests
ptpengine:ip_mode=multicast

; when enabled, instead of sockets, libpcap is used to receive (sniff) and send (inject) packets.
; on low latency hardware such as 10GE NICs this can provide results close to hardware-assisted PTP
ptpengine:use_libpcap=n

; store observed drift in a file
clock:drift_handling=file

; log file, event log only. if timing statistics are needed, see statistics_file
global:log_file=/var/log/ptpd2.log
; log file up to 5M
global:log_file_max_size=5000
; rotate logs up to 5 files
global:log_file_max_files=5

; status file providing an overview of ptpd's operation and statistics
global:log_status=y

; use DSCP 46 for expedited forwarding over ipv4 networks
ptpengine:ip_dscp=46

global:log_level=LOG_ALL
; always keep a new line in the end
Highlighting some important configuration lines:
ptpengine:interface=enp0s31f6This is the network interface that is connected to the network, commonlyeth0orwlp2s0for Wi-Fi. Use the commandip link showto list network interfaces.ptpengine:preset=masteronlyWe set this computer as the master clock as there is no other reference clock.ptpengine:use_libpcap=nI found that the system did not work with this enabled.
A similar configuration file is used on the other computers in the network (the slaves).
; /etc/ptpd.conf for Slave

; interface has to be specified
ptpengine:interface=wlp2s0

; PTP domain
ptpengine:domain=42

; available presets are slaveonly, masteronly and masterslave (full IEEE 1588 implementation)
ptpengine:preset=slaveonly

; multicast for both sync and delay requests - use hybrid for unicast delay requests
ptpengine:ip_mode=multicast

; when enabled, instead of sockets, libpcap is used to receive (sniff) and send (inject) packets.
; on low latency hardware such as 10GE NICs this can provide results close to hardware-assisted PTP
ptpengine:use_libpcap=n

; store observed drift in a file
clock:drift_handling=file

; log file, event log only. if timing statistics are needed, see statistics_file
global:log_file=/var/log/ptpd2.log
; log file up to 5M
global:log_file_max_size=5000
; rotate logs up to 5 files
global:log_file_max_files=5

; status file providing an overview of ptpd's operation and statistics
global:log_status=y

; uncomment this to log a timing log like in previous ptpd versions
global:statistics_file=/var/log/ptpd2.stats

; on multi-core systems it is recommended to bind ptpd to a single core
global:cpuaffinity_cpucore=0

; use DSCP 46 for expedited forwarding over ipv4 networks
ptpengine:ip_dscp=46

clock:step_startup=y
clock:step_startup_force=y
clock:set_rtc_on_step=y
clock:max_offset_ppm=1000

global:log_level=LOG_ALL

; always keep a new line in the end
Again, highlighting the key values:
ptpengine:preset=slaveonlywe now set to slave mode, so it doesn’t try to serve clock data to othersclock:step_startup=y, clock:step_startup_force=y, clock:set_rtc_on_step=yThese options will force the clock to ‘jump’ to the correct time when it first connects to the master clock. The alternative is to wait a very long time for the clock to slowly adjust to the correct time.
Copies of the configuration files are available here
Testing PTP Synchronisation
The PTP service should automatically start on boot and run in the background. On the master computer, PTP won’t start if you are not connected to the network. To view the current status of the PTP service;
systemctl status ptpd
which should give something similar to
● ptpd.service - LSB: start and stop ptpd
     Loaded: loaded (/etc/init.d/ptpd; generated)
     Active: active (running) since Fri 2021-06-11 16:06:06 AEST; 20s ago
       Docs: man:systemd-sysv-generator(8)
    Process: 1010 ExecStart=/etc/init.d/ptpd start (code=exited, status=0/SUCCESS)
      Tasks: 1 (limit: 9050)
     Memory: 2.2M
     CGroup: /system.slice/ptpd.service
             └─1038 /usr/sbin/ptpd -c /etc/ptpd.conf

Jun 11 16:06:06 groundstation.lab systemd[1]: Starting LSB: start and stop ptpd...
Jun 11 16:06:06 groundstation.lab ptpd2[1032]: PTPDv2 version 2.3.1 starting
Jun 11 16:06:06 groundstation.lab ptpd2[1032]: Starting ptpd2 daemon with parameters:      /usr/sbin/ptpd -c /etc/ptpd.conf
Jun 11 16:06:06 groundstation.lab ptpd2[1032]: Loading configuration file: /etc/ptpd.conf
Jun 11 16:06:06 groundstation.lab ptpd2[1032]: Checking configuration
Jun 11 16:06:06 groundstation.lab ptpd2[1032]: Configuration OK
Jun 11 16:06:06 groundstation.lab ptpd2[1032]: Successfully acquired lock on /var/run/ptpd2.lock
Jun 11 16:06:06 groundstation.lab systemd[1]: Started LSB: start and stop ptpd.
If you need to restart the PTP service because you changed the config file, or because the network was not connected when it first started;
sudo systemctl restart ptpd
We can also view some diagnostic information about PTP by looking at the status file
cat /var/run/ptpd2.status
Which, on the master computer, outputs
Host info          :  groundstation.lab, PID 1038
Local time         :  Fri Jun 11 16:09:30 AEST 2021
Kernel time        :  Fri Jun 11 06:09:30 GMT 2021
Interface          :  enp0s31f6
Preset             :  masteronly
Transport          :  ipv4, multicast
Delay mechanism    :  E2E
Sync mode          :  TWO_STEP
PTP domain         :  42
Port state         :  PTP_MASTER
Local port ID      :  a44cc8fffe15dfa9(unknown)/1
Best master ID     :  a44cc8fffe15dfa9(unknown)/1 (self)
Time properties    :  ARB timescale, tracbl: time N, freq N, src: INTERNAL_OSCILLATOR(0xa0)
UTC properties     :  UTC valid: N, UTC offset: 0
Priority1          :  128
Priority2          :  128
ClockClass         :  13
Message rates      :  1/s sync, 1/s delay, 1/2s announce
TimingService      :  current PTP0, best PTP0, pref PTP0
TimingServices     :  total 1, avail 1, oper 1, idle 0, in_ctrl 1
Performance        :  Message RX 2/s, TX 4/s
Announce           :  0 received, 96 sent
Sync sent          :  192
Follow-up sent     :  192
DelayReq received  :  188
DelayResp sent     :  188
State transitions  :  3
PTP Engine resets  :  1
and on the slave computer, we get
Host info          :  jackal01.lab, PID 1369
Local time         :  Fri Jun 11 16:11:32 AEST 2021
Kernel time        :  Fri Jun 11 06:11:32 GMT 2021
Interface          :  wlp2s0
Preset             :  slaveonly
Transport          :  ipv4, multicast
Delay mechanism    :  E2E
Sync mode          :  TWO_STEP
PTP domain         :  42
Port state         :  PTP_SLAVE
Local port ID      :  40ec99fffe63f961(unknown)/1
Best master ID     :  a44cc8fffe15dfa9(unknown)/1
Best master IP     :  192.168.0.3
GM priority        :  Priority1 128, Priority2 128, clockClass 13
Time properties    :  ARB timescale, tracbl: time N, freq N, src: INTERNAL_OSCILLATOR(0xa0)
UTC properties     :  UTC valid: N, UTC offset: 0
Offset from Master :  0.000021641 s, mean -0.000020734 s, dev  0.000158519 s
Mean Path Delay    :  0.001127152 s, mean  0.001133046 s, dev  0.000012998 s
Clock status       :  in control
Clock correction   : -5.739 ppm, mean -5.654 ppm, dev  0.291 ppm
Message rates      :  1/s sync, 1/s delay, 1/2s announce
TimingService      :  current PTP0, best PTP0, pref PTP0
TimingServices     :  total 1, avail 1, oper 1, idle 0, in_ctrl 1
Performance        :  Message RX 6/s, TX 3/s
Announce received  :  157
Sync received      :  312
Follow-up received :  312
DelayReq sent      :  327
DelayResp received :  327
State transitions  :  368
PTP Engine resets  :  47
In the Offset from Master line, you can see we have synchronised to within 21 microseconds.
If you want to monitor the synchronisation status, you can use the watch command
watch -n1 cat /var/run/ptpd2.status
which gives you a live-updating view of the stats.
Monitoring via ROS
I have also written a small ROS node which monitors ptpd2.status and reports the results to ROS. This is useful to monitor the data on another machine, and also to have a record of the time synchronisation in a recorded ROS Bag file.
Reducing Latency over Wi-Fi
As discussed above, the main challenge in network time synchronisation is determining the latency between the master and the slave. The key is not in having a small latency, but a small jitter. Wired ethernet networks have very low latencies and jitters, which is ideal for synchronisation, however you can’t have an ethernet cable connect to a drone as it is flying around. Wi-Fi is the only alternative, but suffers from higher latency and jitter. This can be caused by congestion on the network, or by radio interference from other source, especially when using the 2.4Ghz band.
when initially trying to synchronise, we ran into an issue with high jitter over the Wi-Fi network. For example, we can see this using the ping command
PING quad2.lab (192.168.0.102) 56(84) bytes of data.
64 bytes from quad2.lab (192.168.0.102): icmp_seq=1 ttl=64 time=42.4 ms
64 bytes from quad2.lab (192.168.0.102): icmp_seq=2 ttl=64 time=61.2 ms
64 bytes from quad2.lab (192.168.0.102): icmp_seq=3 ttl=64 time=83.7 ms
64 bytes from quad2.lab (192.168.0.102): icmp_seq=4 ttl=64 time=106 ms
64 bytes from quad2.lab (192.168.0.102): icmp_seq=5 ttl=64 time=25.4 ms
64 bytes from quad2.lab (192.168.0.102): icmp_seq=6 ttl=64 time=47.6 ms
64 bytes from quad2.lab (192.168.0.102): icmp_seq=7 ttl=64 time=76.7 ms
64 bytes from quad2.lab (192.168.0.102): icmp_seq=8 ttl=64 time=91.9 ms
64 bytes from quad2.lab (192.168.0.102): icmp_seq=9 ttl=64 time=12.3 ms
64 bytes from quad2.lab (192.168.0.102): icmp_seq=10 ttl=64 time=34.8 ms
64 bytes from quad2.lab (192.168.0.102): icmp_seq=11 ttl=64 time=56.7 ms
64 bytes from quad2.lab (192.168.0.102): icmp_seq=12 ttl=64 time=77.9 ms
64 bytes from quad2.lab (192.168.0.102): icmp_seq=13 ttl=64 time=107 ms
64 bytes from quad2.lab (192.168.0.102): icmp_seq=14 ttl=64 time=24.8 ms
64 bytes from quad2.lab (192.168.0.102): icmp_seq=15 ttl=64 time=42.7 ms
64 bytes from quad2.lab (192.168.0.102): icmp_seq=16 ttl=64 time=65.3 ms
64 bytes from quad2.lab (192.168.0.102): icmp_seq=17 ttl=64 time=88.0 ms
64 bytes from quad2.lab (192.168.0.102): icmp_seq=18 ttl=64 time=111 ms
64 bytes from quad2.lab (192.168.0.102): icmp_seq=19 ttl=64 time=30.5 ms
64 bytes from quad2.lab (192.168.0.102): icmp_seq=20 ttl=64 time=53.0 ms

--- quad2.lab ping statistics ---
20 packets transmitted, 20 received, 0% packet loss, time 19033ms
rtt min/avg/max/mdev = 12.313/61.894/110.505/28.966 ms
The latency not only high, but also highly inconsistent, an average of 61 ms with a deviation of 29 ms. When we try to synchronise using PTP, we get
Offset from Master :  0.085416869 s, mean  0.103360017 s, dev  0.021307977 s
Mean Path Delay    :  0.030811354 s, mean  0.031216654 s, dev  0.000908046 s
Clock correction   :  1000.000 ppm (slewing at maximum rate)
which indicates that the synchronisation is only accurate to within 100ms, because the jitter on the Wi-Fi is so high. The clock correction is also high as it is constantly trying to adjust the clock back and forth.
After much trial and error, and after replacing the Wi-Fi router and changing to a 5 Ghz network, the root cause of the problem was determined to be a power-saving feature in the Wi-Fi card. In order to save power, the Wi-Fi chip will buffer outgoing packets for some period of time and then send them all at once. Ordinarily, this is useful for most activities, but for time-sensitive packets, such as PTP, this introduces an unknown delay in the network, making it extremely difficult to get accurate time synchronisation.
If we look at iwconfig wlan0, we can see that power management is turned on
wlan0     IEEE 802.11  ESSID:"Teleop5G"
          Mode:Managed  Frequency:5.18 GHz  Access Point: E0:46:9A:0E:A7:AD
          Bit Rate=300 Mb/s   Tx-Power=22 dBm
          Retry short limit:7   RTS thr:off   Fragment thr:off
          Power Management:on
          Link Quality=55/70  Signal level=-55 dBm
          Rx invalid nwid:0  Rx invalid crypt:0  Rx invalid frag:0
          Tx excessive retries:0  Invalid misc:2924   Missed beacon:0
This can be disabled temporarily by
sudo iwconfig wlp2s0 power off
or permanently by editing /etc/NetworkManager/conf.d/default-wifi-powersave-on.conf to
[connection]
wifi.powersave = 2
After disabling power saving, we can run the same ping test
PING quad2.lab (192.168.0.102) 56(84) bytes of data.
64 bytes from quad2.lab (192.168.0.102): icmp_seq=1 ttl=64 time=6.23 ms
64 bytes from quad2.lab (192.168.0.102): icmp_seq=2 ttl=64 time=4.66 ms
64 bytes from quad2.lab (192.168.0.102): icmp_seq=3 ttl=64 time=2.72 ms
64 bytes from quad2.lab (192.168.0.102): icmp_seq=4 ttl=64 time=5.61 ms
64 bytes from quad2.lab (192.168.0.102): icmp_seq=5 ttl=64 time=4.73 ms
64 bytes from quad2.lab (192.168.0.102): icmp_seq=6 ttl=64 time=2.67 ms
64 bytes from quad2.lab (192.168.0.102): icmp_seq=7 ttl=64 time=6.36 ms
64 bytes from quad2.lab (192.168.0.102): icmp_seq=8 ttl=64 time=4.70 ms
64 bytes from quad2.lab (192.168.0.102): icmp_seq=9 ttl=64 time=2.66 ms
64 bytes from quad2.lab (192.168.0.102): icmp_seq=10 ttl=64 time=5.81 ms
64 bytes from quad2.lab (192.168.0.102): icmp_seq=11 ttl=64 time=3.72 ms
64 bytes from quad2.lab (192.168.0.102): icmp_seq=12 ttl=64 time=6.67 ms
64 bytes from quad2.lab (192.168.0.102): icmp_seq=13 ttl=64 time=4.60 ms
64 bytes from quad2.lab (192.168.0.102): icmp_seq=14 ttl=64 time=2.80 ms
64 bytes from quad2.lab (192.168.0.102): icmp_seq=15 ttl=64 time=5.73 ms
64 bytes from quad2.lab (192.168.0.102): icmp_seq=16 ttl=64 time=3.70 ms
64 bytes from quad2.lab (192.168.0.102): icmp_seq=17 ttl=64 time=1.71 ms
64 bytes from quad2.lab (192.168.0.102): icmp_seq=18 ttl=64 time=4.78 ms
64 bytes from quad2.lab (192.168.0.102): icmp_seq=19 ttl=64 time=2.91 ms
64 bytes from quad2.lab (192.168.0.102): icmp_seq=20 ttl=64 time=3.36 ms

--- quad2.lab ping statistics ---
20 packets transmitted, 20 received, 0% packet loss, time 19035ms
rtt min/avg/max/mdev = 1.707/4.306/6.673/1.427 ms
which gives much better results, and consequently gives much more accurate clock synchronisation.
Offset from Master :  0.000350521 s, mean  0.000476847 s, dev  0.000197259 s
Mean Path Delay    :  0.001573168 s, mean  0.001654377 s, dev  0.000038292 s
Clock correction   : -48.575 ppm, mean -62.242 ppm, dev  3.963 ppm